SEC-SAXS: Data Analysis
SECPipe and SECData
SECPipe is a real-time data processing and initial analysis pipeline program designed for BL4-2 automatic SEC-SAXS data collection and analysis. This program is written in Python and implements the SASTOOL and ATSAS AUTORG. programs. The first 100 scattering images (default, but can be changed) will be assigned as background images by default. First, the program SASTOOL is employed for scaling, azimuthal integration and averaging of background scattering curves, followed by consecutive background subtraction for each frame. Then individual scattering curve is immediately passed to the program AUTORG for Guinier analysis.
During data collection, the user can watch the real-time Rg/I(0)/I(pL) plots as well as UV absorbance on the Blu-Ice SECSAXS tab. In addition, the sample concentration of the fraction can be monitored by adding the extinction coefficient of the sample. The comparison between I(o) and I(qL), intensity at qL (a q value in the lower q region), serves as a sensitive indicator for quick quality check of the SEC-SAXS data (see the beamline SEC-SAXS paper for more details). After the data collection is done, the SECPipe will generate a variety of plots and 5-image average curves for further inspection.
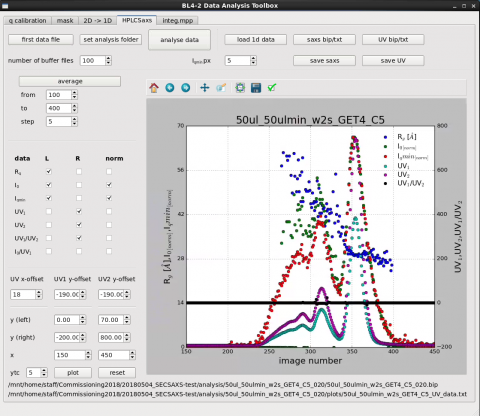
SECData can be run from a command line, providing the ability to re-analyze data after the experiment (see more details here). A GUI program, bl42-dat, is available at BL4-2 for further careful analysis.


Figure 5 (Top): Some examples of SECPipe outputs. (Bottom): The program bl42-dat. The user can carefully investigate the quality of separation and peak of interest using UV and SAXS elution profiles.
