
| |

BL4-2 Home |
Help for Plot Tab of the SasTool GUI VersionThe Plot tab is where you specify how the results should be displayed. The Plot tab looks like the image below (with annotations for easier reference in this help document).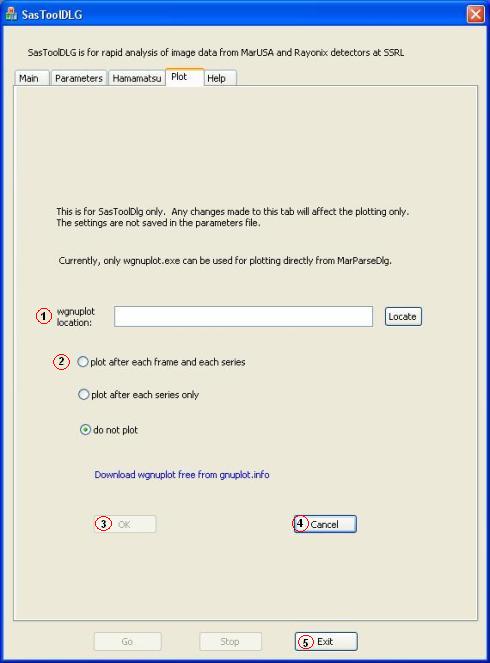
SasToolDLG will use wgnuplot.exe to plot the results (.dat files), if requested, while in the dynamic tracking mode. The user can download wgnuplot.exe by click on the link "Download wgnuplot free from gnuplot.info" on this tab. Use parameter (1) to specify where to find the wgnuplot.exe. Use parameter (2) to specify how frequently the results should be displayed. If you want to make the changes effective and go back to the "Main" tab, click on the "OK" button (3). If you do not want the changes to take effect, click the "Cancel" button (4), the program will go to the "Main" tab. To terminate the program, click the "Exit" button (5). Help for the Main Tab |
| webmaster (remove spaces in email address) | Last updated: February 01, 2017. |