Graph-It Documentation
The Graph-It program is used to display and quickly browse through the various data collected at the beamline. It recognizes some of the special format files utilized at the beamline but can be used to display any one, two or three column data set. Several tools for data manipulation, processing and analysis are embeded into the program and can be convenietly called directly out of the Graph-It interface. For example as a tool for Guinier approximation, which produces a Guinier plot and can be used to estimate the molecular weight or the protein, a tool, Data Math, for basic mathematical operation on the data files, an interface for peak fitting (with different peak profiles available) etc.
The program is started by opening a terminal window (right click on the background and choose "Open Terminal" in the Menu) on the beamline control computer (bl42cpu) or through the NX remote interface. At the command line prompt type Graphit.
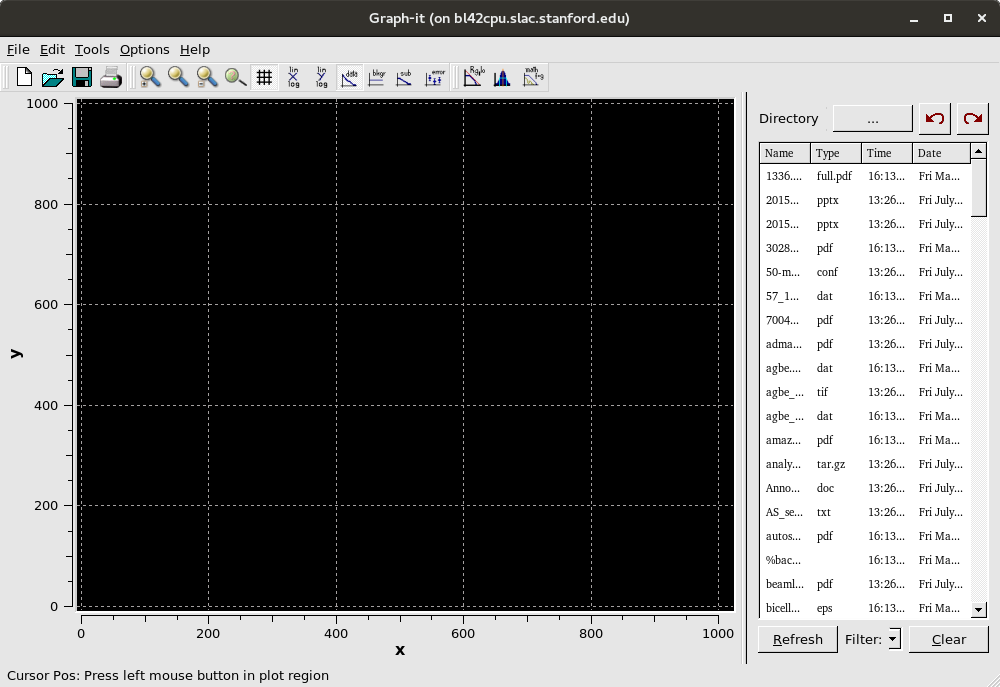
This will open the main window of Graph-It wit the main plotting area on the left and a file-browser on the right.