
 oxidizes Fe(III) to Fe(IV) and a nearby organic group (R) to a radical (R+) to give the intermediate 'Compound I.' Two successive one-electron transfer reactions convert Compound I first to Compound II (where the organic radical is reduced); then Fe(IV) is reduced back to the Fe(III) resting state, completing the catalytic cycle.")
The high-valent iron-oxygen species (Fe(IV)-O) is a critically important intermediate in a number of metalloenzymes. The relatively high redox potential of Fe(IV)-O enables this intermediate to serve as a potent oxidant utilized by several iron containing enzymes such as cytochrome P450, nitric oxide synthase, cytochrome oxidase and numerous peroxidases1. Most iron-containing peroxidases operate by the multi-step mechanism shown in Figure 12.
X-ray absorption spectroscopic studies 3 of Compound I reveal that the Fe(IV)-O bond is relatively short, less than 1.7 Å, indicating an iron-oxygen double bond-like, oxene bond with a second electron pair donated by the oxygen into an empty iron orbital4 as opposed to a single bond. However, the majority of x-ray crystal structures of Compound I have yielded longer distances of 1.8-1.9 Å5,6 indicating single bond character. The chemistry of these two species is quite different and knowing the correct structure is essential for understanding the details of these enzyme mechanisms.
A serious problem encountered with high-intensity synchrotron x-ray sources is the rapid reduction of metal centers, particularly high-potential metal centers such as Fe(IV)7. As a result, it is likely that the crystallographic structures determined from this data will represent a combination of oxidation states at best. Thus, methods were developed at SSRL for collecting diffraction data from high-valent oxidized metalloenzymes with minimal radiation damage.

First, the decay rate of the oxidized species as a function of x-ray dose was determined at 65 K using a prototype single-crystal microspectrophotometer installed on Beam Line 9-2. Figure 2A shows the single crystal spectrum of Compound I as a function of x-ray dose. Before data collection, the spectrum was identical to the solution spectrum of Compound I. After extensive x-ray exposure (inset to Figure 2A) the spectrum clearly was no longer that of Compound I. Figure 2B shows the estimated percentage of Compound I remaining in the crystal as a function of x-ray exposure as monitored by changes in the visible spectrum. Based on this plot, only 80% of Compound I remains in the crystal after receiving an x-ray dose of 0.035 MGy. Therefore, a data collection strategy for obtaining predominantly Compound I was employed using multiple crystals, none of which received more than 0.035 MGy. With this maximum dose, the resulting structure was estimated to be comprised of ~90% Compound I (integrated over the 0.035 MGy dose).
Crystallographic data collection was carried out on BL9-2. Nearly 100 crystals were automatically mounted, indexed and screened using the Stanford Auto-Mounter (SAM) system to select samples of similar size and diffraction quality to use for data collection. For each crystal selected, diffraction data was measured to 1.4 Å resolution for a 5 sample rotation range, representing the first 0.035 MGy of x-ray exposure. The starting rotation angle for subsequent crystals was chosen to optimize the completeness of the data using a minimum number of samples. (A completeness of ~98% was achieved with only 19 crystals.) The same 5 of rotation angle were recollected 12 more times for each crystal yielding multiple complete data sets with increasing x-ray dose.
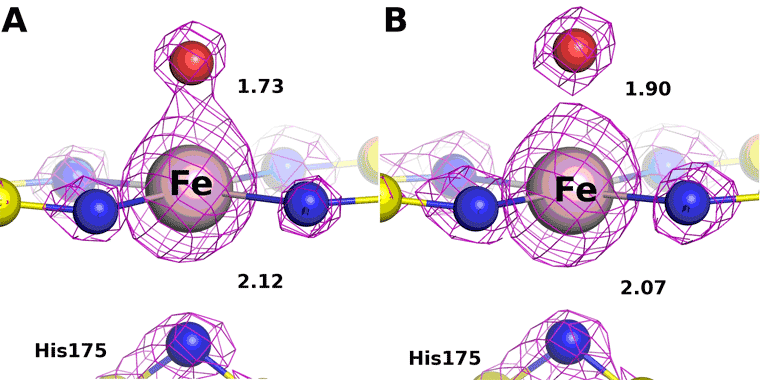
The low and high dose structures are shown in Figure 3. The iron to oxygen bond length increases from 1.73 to 1.90 Å, respectively. The bond length varies linearly with dose (Figure 4) and the bond length for the zero dose Compound I structure is estimated to be 1.72 Å. This value is very close to the spectroscopic measurements confirming the shorter oxene Fe-O bond.

Based on this study, a general method has been developed to collect x-ray diffraction data from high-valent oxidized metalloproteins. The equipment required to carry out these experiments, including a continuous flow helium cryostat and UV-Vis microspectrophotometer, will be permanently installed on Beam Line 9-2. These instruments will be integrated into the control system (Blu-Ice/DCS) and a new tab will be created for carrying out these experiments in an automated fashion, fully compatible with remote data collection.
1. Poulos, T. L., and Kraut, J. (1980) J Biol Chem 255, 8199-8205.
2. Meharenna, Y. T., Oertel, P., Bhaskar, B., and Poulos, T. L. (2008)Biochemistry 47, 10324-10332.
4. Everse, J. (1998) Free Radic Biol Med 24, 1338-1346.
5. Behan, R. K., and Green, M. T. (2006) J Inorg Biochem 100, 448-459.
6. Hersleth, H. P., Hsiao, Y. W., Ryde, U., Gorbitz, C. H., and Andersson, K. K. (2008) Chem Biodivers 5, 2067-2089.
3. Green, M. T., Dawson, J. H., and Gray, H. B. (2004) Science 304, 1653-1656.
7. Corbett, M. C., Latimer, M. J., Poulos, T. L., Sevrioukova, I. F., Hodgson, K. O., and Hedman, B. (2007) Acta Crystallogr D Biol Crystallogr 63, 951-960.
Meharenna, Y.T.; Doukov, T.; Li, H.; Soltis, S.M.; Poulos, T.L. “Crystallographic and single-crystal spectral analysis of the peroxidase ferryl intermediate,” (2010) Biochemistry 49, 2984-2986.
