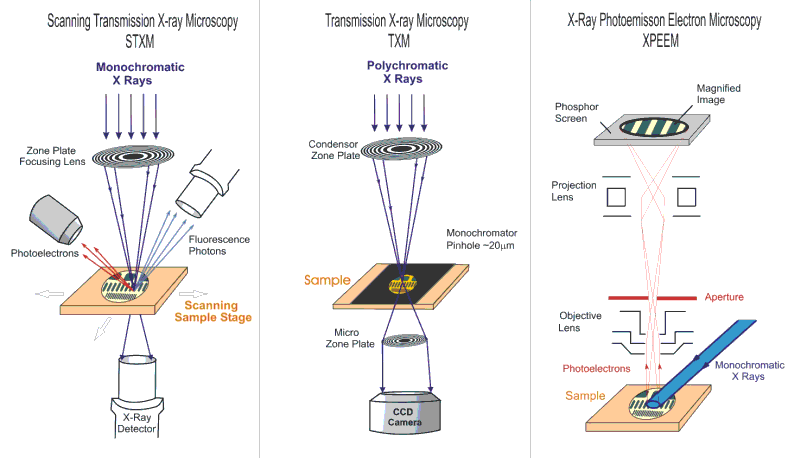
Fig. 1 (click to enlarge): Three different types of x-ray Microscopes. A scanning transmission x-ray microscope (STXM, left) a full field transmission x-ray microscope (TXM, middle) and a photoemission electron microscope (PEEM, right).
In the section about X-ray Absorption we already pointed out that there are two different ways to record an x-ray absorption spectrum, either by detecting the transmitted photons or electrons that have been ejected due to secondary processes. Consequently there are different types of microscopes that image the spatial variation of the x-ray absorption cross sections as shown in figure 1. The two microscopes on the left are pure x-ray microscopes. Both instruments use x-ray lenses, so called zoneplates to focus the x-rays onto a sample. In the case of the scanning transmission x-ray microscopes only one x-ray lens is used while the sample is scanned line by line while simultaneously detecting the transmitted intensity with a photodiode. The scanning transmission x-ray microscope easily and efficiently allows to extract spectroscopic data from small sample spots (approx 30-50nm). It is also very compatible with modern insertion device x-ray sources. The full field microscope TXM on the other hand uses a second lens to form an image of the sample that is detected using an image detector. The full field imaging technique currently provides slightly better spatial resolution (approx. 10-20nm) but here the coherence of the incoming x-rays lead to unwanted interference effects ( speckle ) in the image. Finally we would like to point out that one can also image the spatial variation of the total electron yield using a photoemission electron microscope or PEEM. This type of microscope uses electrostatic lenses to produce a magnified image of the electrons yield distribution at the surface of the sample. As the total electron yield mode to acquire x-ray absorption spectra it is a very surface sensitive technique.
Fig. 2 (click to enlarge): Soft x-ray magnetic imaging using for example PEEM, STXM or TXM. A layer in the sample is selected by tuning the x-ray energy to the desired element. X-ray polarization contrast at an absorption peak is used for imaging contrast. The local electron yield from a sample region depends on the relative orientation of the magnetic direction or axis and the polarization, as illustrated on the right.
Since handed circularly polarized x-rays have directionality they can detect the direction of the spin and orbital moments, a fact utilized in XMCD microscopy of ferromagnets. Similarly, the dependence of the XMLD intensity on the relative orientation of the electric field vector and the magnetic axis can be used for XMLD imaging and proves especially useful for antiferromagnets. Such systems cannot be studied by many techniques because of their compensated spin structure. Fig. 2 shows how XMLD and XMCD imaging is done by means of photoemission electron microscopy.
Fig. 3 (click to enlarge): Coupling of domains in an antiferromagnet (left) with those in a ferromagnet (right). The green ferromagnetic domains contain two subdomains with magnetization directions to the left and right. They cannot be distinguished for the geometry used but would be visible if the sample was rotated relative to the x-ray direction (see below)
Let us assume that we have a sandwich sample consisting of a ferromagnet and an antiferromagnet. First, we tune the photon energy to an element in the antiferromagnet, say Fe in LaFeO3, as shown in Fig. 6. We then change the x-ray polarization to linear and fine-tune the x-ray energy to 721 eV where a large XMLD effect exists, as shown in Figs. 3 or 6. When we image the electron intensity with PEEM at this energy, domains with their axis perpendicular to the E vector will give a higher electron yield than those with their axis parallel to the E vector. In order to enhance the contrast we take a second image at 723eV, where the contrast is inverted and divide the two images. This gives us the antiferromagnetic domain structure.
We now tune the energy to the ferromagnetic element, say Co, and change the polarization to left circular. We fine-tune to the Co L3 energy, 778eV, and take an image. Domains with their magnetization direction pointing into the photon propagation direction will give the largest electron intensity, as illustrated in Fig. 6 bottom right. We then change the polarization to right circular and take another picture with opposite contrast. Division of the two images gives us the ferromagnetic domain structure.
Fig. 4 (click to enlarge): Ferromagnetic domain pattern for a thin Co layer on NiO(100), showing all four spin directions in Co. The spin directions are pinned by the underlying NiO.
Finally, we show how one can choose a special geometry to image all four ferromagnetic domains in a situation like that encountered for Co/LaFeO3(100) of Fig. 3. The same four domain geometry is also encountered for Co/NiO(100), and in Fig. 4 we show results for the Co domain pattern on NiO(100). By rotating the sample so that one magnetization direction makes the "magic projection angle" of 18.4o with the x-ray propagation direction (red wiggly arrow), one can distinguish all four domains as shown on the left. At this angle the contrast reflects equal XMCD intensity differences as shown on the right for the Co L3 peak. The spectra were recorded for the regions marked with green, black, red and blue dots in the image. In our case the XMCD effect gives rise to a 6% change from curve to curve with a total effect of about 18% between the green and blue curves.