Platinum nanostructures have received a great deal of attention because of their unique size and shape dependent catalytic properties. Study of the kinetics and growth mechanism of these nanostructures not only contributes to a fundamental understanding of crystal growth at the nanoscale, but also provides an essential means to predict the conditions needed for controlled synthesis to tailor desired properties. An understanding of the growth of metal nanocrystals has mainly been developed through ex situ studies by quenching the growth at different reaction times and examining the intermediate products using X-ray diffraction (XRD), transmission electron microscopy (TEM), and spectroscopy techniques.
In this study in situ and ex situ techniques were used to investigate the growth of platinum nanocrystals in solution. Synchrotron-based XRD was employed to study the growth of platinum nanocrystals in real time and to provide a direct assessment of the crystallinity, nanocrystal concentration, and crystallite size of the product. TEM was then used to investigate the nanoparticle morphology at different growth stages.
The synthesis involved thermal decomposition of a platinum precursor in a reaction cell in the presence of a stabilizing agent, under a hydrogen atmosphere. For the in situ XRD, the reaction cell was made of stainless steel and measurements were conducted at the Stanford Synchrotron Radiation Lightsource (SSRL) at beam line 7-2. Two different concentrations, referred to as low and high concentrations were investigated. For each experiment, about 0.05 mL of the precursor solution was injected to the reaction vessel. The cell was flushed through with H2, before being filled to 200 kPa H2 and heated to 70°C, which was the temperature maintained for the duration of the experiment. Products collected from the experiments were purified and the samples studied in the TEM.
In situ X-ray diffraction
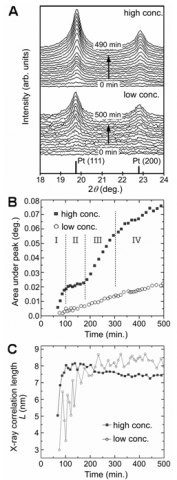
In situ XRD plots for both low and high concentration experiments are shown in Figure 1A. As the reactions proceed, small peaks corresponding to Pt(111) and Pt(200) begin to emerge and progressively grow over time. The initial peaks are generally broad indicating the formation of small crystallites. As the reaction proceeds the peak areas increase indicating an increase in the concentration of nanocrystalline platinum ([PtNC]) and the peaks get narrower indicating an increase in the average crystallite size.
Figure 1B shows the plot of area under the Pt(111) peak against time. The peak area plot for the low concentration reaction increases approximately linearly over the course of experiment, indicating a continuous and almost linear increase of [PtNC].
For the high concentration reaction, the peak area plot is more complex and can be divided into four stages based on the slope: Stage I: ~60 100 min.; Stage II: 100 180 min.; Stage III: 180 300 min.; Stage IV: 300 500 min. The peak area increases rapidly and linearly in Stage I, indicating a ten fold increase in the growth rate of [PtNC] compared to the low concentration reaction. Remarkably, during Stage II, the peak area remains almost constant, indicating almost no growth in [PtNC]. In Stage III, the peak area resumes a rapid increase; the gradient is ~60% of that observed in Stage I. From the beginning of Stage IV to the end of experiment, the slope of the area plot decreases slightly, with a gradient of about 1/3 of that in the previous stage (Stage III), indicative of a slower increase in [PtNC].

The X-ray correlation length (L) for the low concentration reaction increases from 3 nm at 75 minutes to 8.6 nm at 230 minutes. It then remains almost constant at ~8.4 ± 0.3 nm for the remainder of the reaction. For the high concentration reaction, L increases during Stage I from ~5 nm to ~8.2 nm at 100 minutes. During Stage II, Lremains almost constant at 8.0 ± 0.2 nm. Interestingly during Stage III, Ldecreases from 8.1 nm to 7.6 nm, differing markedly from the low concentration reaction. After 300 minutes, L continues to decrease gradually and is calculated to be ~7.4 nm at the end of Stage IV.
Transmission electron microscopy
TEM images of platinum nanoparticles obtained from the low concentration reaction show faceted nanoparticles of irregular shapes, with particle sizes of 6 ± 2 nm. The size range is consistent with the X-ray correlation length shown in Figure 1C. TEM images of the platinum nanoparticles collected after 400 minutes display similar morphologies to those observed at 80 mins but are of bigger size at 11 ± 3 nm, again consistent with XRD.
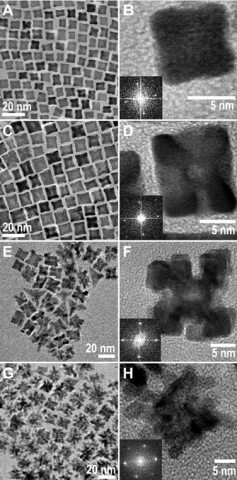
Figures 2A, C, E, and G show the TEM images of platinum nanoparticles collected from the high concentration reaction at 75, 120, 240, and 500 minutes, corresponding to Stages I to IV, respectively. As shown in Figure 2A, the platinum nanocrystals formed in the middle of Stage I adopt a nearly cubic morphology with eight arms/pods, described as quasi-octapods. Figure 2C shows the platinum nanocrystals collected in the middle of Stage II are larger and have thinner cross-sections towards the center of the {100} faces, indicative of etching. For this reason we describe these nanocrystals as etched-octapods. Figure 2E and G shows the platinum nanocrystals formed in Stage III and are described as porous platinum or porous nanocrystals.
Growth mechanism: Low concentration.
The peak area plot in Figure 1B shows the [PtNC] growth rate is much slower for the low concentration reaction, compared to the high concentration reaction. TEM indicates the formation of faceted and non-branched morphologies from an early growth stage. Slow nanocrystal growth and formation of faceted, non-branched morphologies are known to be characteristic of growth in a thermodynamically controlled regime. Nanocrystal growth in the low concentration reaction therefore occurs under thermodynamic control via a slow, nearly layer-by-layer monomer addition onto the crystallite faces to yield stable, faceted morphologies.
Growth mechanism: High concentration reaction.
Stage I: Formation of quasi-octapods. The XRD data show that the increase of [PtNC] during Stage I is rapid: there is fast nanocrystal growth. A fast growth rate has been associated with kinetically controlled growth, which often leads to a complex growth pattern and nanocrystals having branched quasi-octapods morphologies.
Stage II: Quasi-octapods → etched-octapods. There is little change in the total amount of platinum atoms in the nanocrystals ([PtNC]) in Stage II. TEM images show growth on the quasi-octapods takes place over the arms along the <111> directions, while etching has occurred on the {100} facets, leading to the formation of etched-octapods. By correlating the observations in XRD and TEM, the increase in [PtNC] due to nanocrystal growth is balanced by the loss of re-dissolved platinum atoms from the nanocrystals as a consequence of etching; hence the [PtNC] peak area remains constant over this growth stage.
Stage III: Etched-octapods → porous nanocrystals. The relatively rapid increase in [PtNC] in Stage III is similar to that observed in Stage I, again indicating kinetic control. However, the slight decrease in L suggests an unconventional type of growth. The cross-sections towards the center of the (100) faces of the porous nanocrystals at 240 minutes are noticeably thinner (Figure 2F) as compared with those of the etched-octapods (Figure 2D). A significant change in the particle morphology is gradually taking place, which is characterized by etching of much of the central core and the formation of more branches. These changes lead to an increase of porosity in the nanocrystals. As the nanocrystals become increasingly porous, the average size of the single crystalline domains, and hence L, decreases. Figure 3 illustrates the proposed growth mechanism from Stage I to III.

These findings demonstrate the utility and complementarity of TEM and in situ XRD for revealing the growth mechanism of nanocrystals of different morphologies. Furthermore, it is hoped that the understanding developed will aid in the design of new synthetic methodologies, which are applicable to other fcc metals, as shown by our application to palladium.1
1. J. Watt, S. Cheong, M. F. Toney, B. Ingham, J. Cookson, P. T. Bishop, R D. Tilley 'Ultra-fast Growth of Highly Branched Palladium Nanostructures for Catalysis' ACS Nano, in press. DOI: 10.1021/nn901277k
Cheong, S., Watt, J., Ingham, B., Toney, M. F. & Tilley, R. D. In situ and ex situ studies of platinum nanocrystals: growth and evolution in solution. J. Am. Chem. Soc. 131, 14590-14595 (2009).

