 Uri Raviv,*,+ Daniel J. Needleman,*,+ Youli
Li,*,+
Herbert P. Miller,+ Leslie Wilson,+ and Cyrus R. Safinya
*,+
*Materials Department, Physics Department +Molecular, Cellular, and Developmental Biology Department, Biomolecular Science and Engineering Program, University of California, Santa Barbara, CA 93106
In this work we explored the structured that form when cationic liposomes are
mixed with microtubules (MTs). Using synchrotron small angle X-ray diffraction
(SAXRD) and transmission electron microscopy (TEM), we find two novel
structures(1). For soft and intermediate rigid membranes we find that the
cationic liposomes spread and coat the MTs and the external lipid layer is
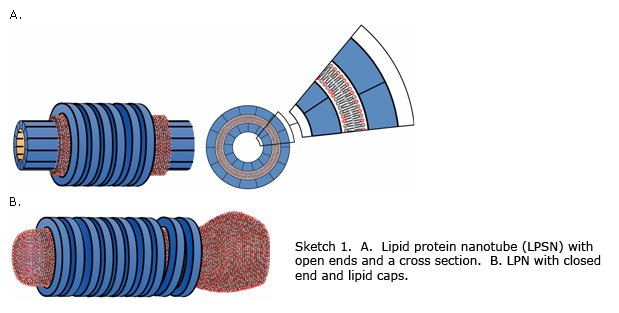
decorated by tubulin oligomers, forming a novel lipid-protein nanotube (LPN).
By controlling the cationic lipid/tubulin stoichiometry,
RCL/T, of the complex
the LPN can switch between a state with open ends (Sketch 1A) to a state with
closed ends with lipid caps (Sketch 1B). This form the basis for controlled
drug encapsulation and release.
For low membrane charge density, we find that vesicles adsorb onto the MT and
appear as 'beads on a rod' (BOR). This is the most trivial structure that can
form when vesicles interact with polyelectrolytes and was previously
hypothesized for cationic lipid-DNA complexes(2), but later was
experimentally(3, 4) proven unstable. Here we discovered for the first time how
to obtain BOR. This state however seems to be, a kinetically trapped state. The
ground state of the system follows the MT template and forms the LPN.
MTs are net negatively charged polymers, which self-assemble from tubulin
protein subunits into hollow cylinders, which are ~26 nm in diameter. The
tubulin dimers are arranged head to tail in protofilaments and form the MT
wall.
Tubulin was purified from bovine brains and was polymerized and taxol
stabilized as described (1, 5). The cationic lipid used was
dioleoyl(C18:1)-trimethyl ammonium propane (DOTAP). The membrane charge density, s, was
adjusted by adding a homologous neutral lipid of the same hydrophobic tail to
the charged lipid, but with the phosphatidylcholine (PC) head group instead
(DOPC). Equal volumes of MTs and liposome solutions were mixed and the
resulting complexes were characterized by transmission electron microscopy
(TEM) and small angle X-ray diffraction (SAXRD) performed at Stanford
Synchrotron Radiation Laboratory, beam-line 4-2.
The mole fraction of cationic lipids in the membrane is given by

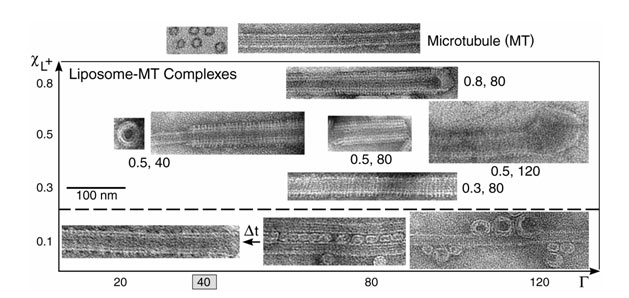
A set of TEM images covering the structures in the phase diagram of MT-membrane complexes are shown in Figure 1. For cationic lipid mole fraction, xCL = 0.1, we initially find the weakly positive charged vesicles ('beads') adsorbed onto the negatively charged microtubule, MT, wall ('rod'), forming the beads on a rod, BOR (Figure 1, lower right). Bridges are occasionally formed between adjacent MTs forming small sized bundles of MTs cross-linked via vesicles (Figure 1, lower center). This state is, however, kinetically trapped: over longer times, ~60 hrs, the adsorbed vesicles "wet" the MT surface, forming the lipid-protein nanotube, LPN (Figure 1, lower left). For xCL > 0.1 the LPN forms immediately upon mixing. The images reveal that the LPN is made of three layers: Intact MTs are coated by a lipid bilayer (appears brighter in the images, as the ionic stain avoids the hydrophobic lipid tails), which in turn are coated by tubulin oligomers forming rings or spirals. The oligomer orientation is perpendicular to the internal MT protofilament direction and their density increases with xCL. The three layered LPN structure arises because of the mismatch between the charge densities of MTs and cationic membranes. The oligomers coat the external lipid monolayer to optimize the electrostatic interactions and counterion release.
At a given mole fraction of cationic lipids, xCL, when the total MT surface area exceeds the total membrane area, the MTs are only partially coated (Figure 1, xCL = 0.5 and cationic lipid/tubulin stoichiometry, RCL/T = 40), forming LPN with open ends. When the reverse is true, some of the excess vesicles are attached primarily to the ends of the LPNs (Figure 1, xCL = 0.5, RCL/T = 120), forming LPN with closed ends with lipid caps. The oligomer density at a given xCL is similar for both open and closed LPNs. The ability to switch from open to closed LPNs forms the basis of controlled drug encapsulation and release.
 |
Figure 1. Transmission electron microscopy images of the various states. Whole mount images of pure MTs (top, right), as a control, and liposomes-MT complexes, using DOTAP/DOPC solutions with xCL ≡ NCL/(NCL+NNL) and RCL/T ≡ NCL/NT values as indicated. For xCL = 0.1 (below the broken line) the kinetically trapped BOR and bridging states are shown on the right and the LPN state after time Dt ~ 60 hrs, (indicated by arrow) is shown on the left. Cross sections of pure MT (top, left) and the LPN structure (little square) are also shown. The mixing isoelectric point RCL/T = 40 is marked. |
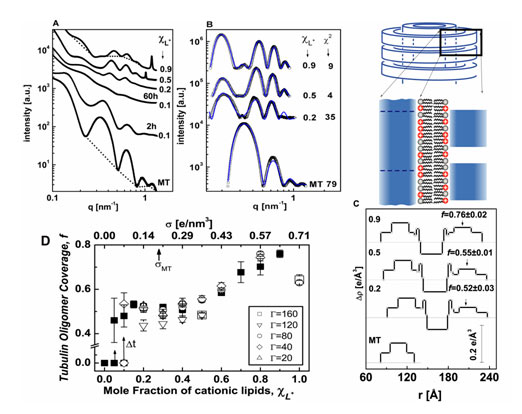
TEM images and SAXRD measurements performed on pure microtubule, MT, solutions (Figures 1 and 2) and are in agreement with earlier studies(5-9). The SAXRD profile of MTs (Figure 2A) is consistent with the form factor of isotropic hollow cylinders (Figure 2B). Based on MT structural data (6, 10), we modeled the MT as three concentric cylindrical shells, of a high electron density region surrounded by two low ones, as shown in Figure 2C, keeping the total wall thickness and mean electron density as those of MTs. The thickness and location of the high electron density region, within the MT wall, and the inner MT radius are fitting parameters in this model.
A set of SAXRD data for MT-lipid (DOTAP/DOPC) complexes is shown in Figure 2A. For xCL > 0.1 the SAXRD scans show broad oscillations that are different from that of MTs and correspond to the form factor of the LPNs. For xCL = 0.1, 2 hrs after MTs and membranes were mixed, the SAXRD scan is consistent (for q > 0.2 nm-1) with the form factor of isotropic MT solutions. At smaller angles there is an additional broad Gaussian correlation peak, centered at q = 0.139 nm-1, corresponding to 45 nm. The SAXRD scan is therefore consistent with the BOR and bridging states (Figure 1). The existence of a correlation peak suggests that the size distribution of the bridging vesicles is relatively narrow. SAXRD scans taken 60 hrs after mixing (Figure 2A), show that this structure slowly evolves into the form factor of the LPNs.
 |
Figure 2. Synchrotron small angle x-ray scattering data, analysis and a state diagram. A. Radially averaged scattering intensities of MTs and MT-lipid complexes (solid symbols), using DOTAP/DOPC solutions with xCL ≡ NCL/(NCL+NNL) as indicated in the figure. RCL/T ≡ NCL/NT is given by RCL/T = 160·xCL, corresponding to the point at which the total amount of lipid is exactly enough to coat each MT with a bilayer. For xCL = 0.1 two scans are shown, 2 hrs and 60 hrs after preparing the sample. The broken curves are examples of the assumed background(5, 7, 8). B. Scattering data from A, following background subtraction (open symbols). The solid curves are the fitted scattering models. Their c2 values are as in the figure. C. The variation of the radial electron density, Dp(r), relative to water (broken lines), of the MTs and complex walls, obtained from fitting the scattering data in B to models of concentric cylinders. r is the distance from the center of the cylinders. The tubulin oligomer coverage, f, values obtained from the nonlinear fit are indicated on the right side. The schematic represents a vertical cut through the MT-membrane-tubulin complex wall, corresponding to Dp(r). D. State diagram: f as a function of xCL or the membrane charge density, s, when lipids can fully cover the MTs. Each data point is based on scattering data and models as in A-C. Solid squares corresponds to RCL/T = 160·xCL. Open symbols represent different RCL/T values, as indicated in the Figure. For 0 < xCL ≤ 0.1 we initially get f = 0 (corresponding to the BOR structure), over time, Dt ~ 60 hrs, shown by the arrows, we obtain LPNs with higher f values. |
To gain quantitative insight into the organization of the complexes, we analyze the background subtracted SAXRD data, shown in Figure 2B, by fitting to a model. To model the data, a series of power laws that pass through the minima of the scattering intensities was subtracted. We extend the isotropic concentric cylindrical shells model of MTs to include the second lipid bilayer and the third tubulin layer (Figure 2C). The radial electron density profile of the inner MT wall and outer tubulin monolayer are based on the fit to the MT scattering data. The parameters for the electron density profile of the lipid bilayer are based on literature data(11, 12). Finally, the third tubulin layer is multiplied by the fraction, f, of tubulin coverage relative to the inner MT wall. f is the unknown parameter in this model and is allowed to float freely. The scattering models (Figure 2B) fit very well to the data.
The SAXRD scans may also have a resolution limited strong peak (Figure 2A xCL = 0.5, 0.9), corresponding to excess lipid vesicles in the lamellar phase that are associated with the complexes (closing the ends of the LPNs, see Figure 1).
Figures 2D summarizes a series of SAXRD scans as in Figure 2A, analyzed as in Figure 2B&C. A states diagram is obtained, in which f is plotted as a function of xCL or the membrane charge density, s, at various RCL/T values. For xCL = 0, corresponding to pure DOPC membrane, SAXRD scans show only the isotropic MT form factor. This state (indicated as f = 0) is stable for days, indicating that the LPN is induced by the cationic lipids. At 0 < xCL > 0.1, we have kinetically trapped states of BOR and bridging (also indicated by f=0) that evolve slowly into the LPN. For xCL > 0.1, we only see the LPN with f values that increase monotonically with xCL. RCL/T has little effect on f, in agreement with the TEM images (Figure 1).
We have described and characterized the beads on a rod and the lipid-protein nanotube, LPN, structures, the conditions for their formation and the transition between them. By controlling the cationic lipid /tubulin stoichiometry the LPN can be tailored to have open or closed ends with lipid caps. Because the main governing concepts for this self assembly are general(13, 14) we expect synthetic analogs to follow similar assembly pathways, so that synthetic versions mimicking the LPNs (e.g. replacing microtubules with rigid polyelectrolytes) may have applications in chemical encapsulation and delivery. Finally, positively charged membranes are commonly used for non-viral drug and gene delivery and introduced into cells(4). Our results suggest that their association with microtubules, leading to possible changes in their structure and dynamics in cells, is an important consideration in delivery applications using cationic lipids.
Acknowledgements
The work was performed using state-of-the-art synchrotron x-ray scattering techniques at the Stanford Synchrotron Radiation Laboratory (SSRL) at beam-line 4-2, combined with sophisticated electron microscopy at the University of California, Santa Barbara. This project is supported by NSF DMR- 0503347, CTS-0404444, and NIH GM-59288 and NS-13560. The Stanford Synchrotron radiation laboratory is supported by the U.S. DOE. U.R. acknowledges the support of the International Human Frontier Science Program Organization and the European Molecular Biology Organization.
Primary Citation
Raviv, U., Needleman, D. J., Li, Y., Miller, H. P., Wilson, L. & Safinya, C. R.
(2005) Proc. Natl. Acad. Sci.
USA 102 (32), 11167-11172.
References