 |
 |
X-ray Photoelectron Spectroscopy (XPS)
Creation of core holes via Ionization
 |
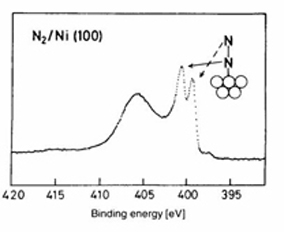 |
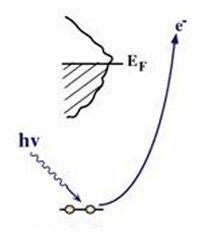
XPS is based on the creation of a core hole via ionization and provides a method to study the geometric, electronic and chemical propert ies of a sample. In XPS, photons with sufficient energy hn are absorbed by a system causing core electrons are ejected from the sample. If the energy of the photons, hn, < /font>is larger than the binding energy of the electron (Eb), the excess energy is converted to kinetic energy of the emitted photoelectron (Ek). Knowledge of the incoming photon energy and measurement of the kinetic energy via an electron analyzer makes it possible to calculate the binding energy: Eb = hn + Ek + f, where f is the work function of the spectrometer. Since binding energi es of core electrons are characteristic for elements in a certain chemical environment, XPS allows for a determination of the atomic compositions of a sample or the chemical state of a certain element, as well as electronic structure and band structure. In many cases chemical shifts can be used to draw direct conclusions on the local coordination in a system and the electronic change upon adsorption. This informa tion can be used to distinguish different adsorption sites of molecules adsorbed on a surface as shown above right in the XPS spectrum for N2 perpendicularly adsorbed on a Ni(100) surface. Here two well-separated N 1s peaks are observed with a chemical shift of 1.3 eV. The peak with the lowest binding energy, 399.4 eV, corresponds to ionization of the outer N atom, whereas the high binding energy peak at 400.7 eV is due to ionization of the inner N atom. |
|
X-ray Absorption Spectroscopy: Creation of core holes via excitation
 |
 |
 |
|
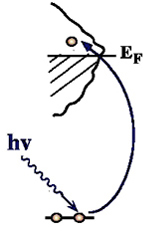
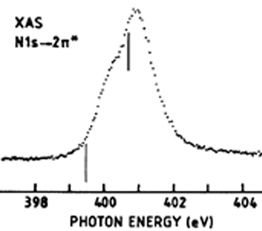
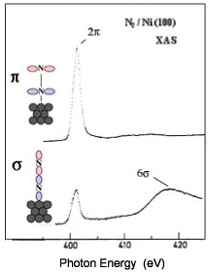
In a one-electron picture the XA spectrum reflects the unoccupied density of states where the position of the Fermi level is porvided by the XPS core level binding energy (see XPS above). In this way it provides element-specific information about the density of states, local atomic structure, lattice parameters, molecular orientation, the nature, orientation, and length of chemical bonds a s well as the chemical state of the sample. Molecular orientation is manifest in the XAS spectra as shown for N2 adsorbed on Ni(100) shown at left. The total intensity of the XA spectrum is given by the number of unoccupied states in the inital state, while the XA spectral shape reflects the density o f states for the core hole state. An example of this can be found above center, which is a enlarged view of the pi-bonding network obtained using XAS. |
||