GIXAFS Sample alignment:
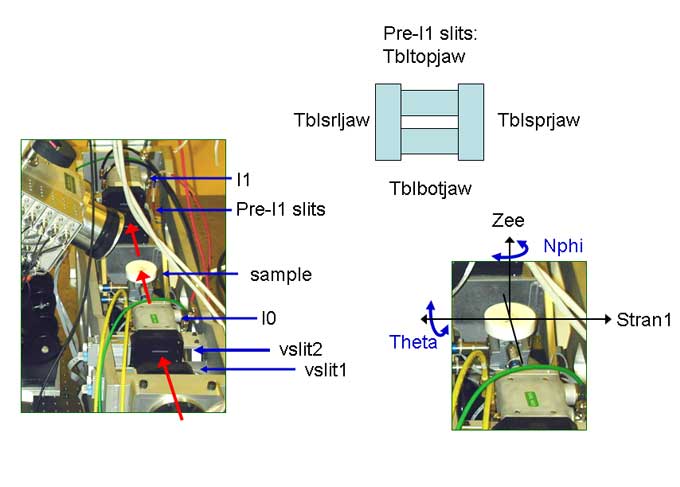
Coarse system alignment (no sample)
There must be measurable beam in I0, no sample.
Check table alignment
- SET the vertical slits (VSLIT1 and VSLIT2) to 800 µm.
(Note: these slits’ values are reported in µm, not millimeters like most other linear dimensions.)
- ADJUST I0 SRS amplifier gain until signal range is 0.5 to 3 V (50,000 to 300,000 cts/s).
- SCAN TBL2VERT vs I0 (-4mm to 4mm, 0.25mm steps, 0.1 s/pt).
Move to the position of max intensity. If the max value is an endpoint, repeat the scan.
Keep accepting at the max intensity of the scan and rescan until you finally find the peak.
- ADJUST I0 SRS amplifier gain until signal range is 0.5 to 3 V (50,000 to 300,000 cts/s).
- SCAN TBL2V2 vs I0 (-1mm to 1mm, .1 steps).
Move to the position of max intensity. If the max value is an endpoint, repeat the scan.
Keep accepting at the max intensity end of the scan and rescan until you finally find the peak.
- SET the VSLIT1 and VSLIT2 values to 200 µm.
- ADJUST I0 SRS amplifier gain until signal range is 0.5 to 3 V (50,000 to 300,000 cts/s).
- SCAN TBL2VERT vs I0 (-1mm to 1mm, 0.05 steps).
Accept position at max intensity.
- SCAN TBL2V2 vs I0 (-.5mm to .5mm, .05 steps).
Accept max value.
- SET the VSLIT1 and VSLIT2 values to 50 µm.
- ADJUST I0 SRS amplifier gain until signal range is 0.5 to 3 V (50,000 to 300,000 cts/s).
- SCAN TBL2VERT vs I0 (-.25mm to .25mm, 0.02 steps).
Accept position at max intensity.
- SCAN TBL2V2 vs I0 (-.3mm to .3mm, .02 steps).
Accept max value.
Continue to Sample Alignment
Sample alignment
System Preparation
The user must reduce the slits to a value appropriate for their sample. These values should not subsequently be changed (unless you want to switch between EXAFS and XSW/Reflectivity) or you’ll have to repeat COARSE SYSTEM ALIGNMENT! The sample must be mounted and located horizontally in the beam.
- ADJUST I0 SRS amplifier gain until signal range is 0.5 to 3 V (50,000 to 300,000 cts/s).
- ADJUST I1 SRS amplifier to have same gain setting as for I0.
- SCAN TBL2VERT vs I0 (-.15mm to .15mm, 0.01 steps).
Accept position at max intensity.
- SCAN TBL2V2 vs I0 (-.2mm to .2mm, .01 steps).
Accept max value.
- SET these motor to appropriate values:
ARM: 0.00
TBLTOPJAW1: 2.00
TBLBOTJAW1: 2.00
- TEST for I1 signal. If no I1 signal is present, then go to step 5b, otherwise go to step 6.
- MOVE ZEE to smaller values until I1 signal rises above 0.01 V (1,000 cts/s).
Align Sample Vertical Position
- MOVE ZEE +1.0mm (relative move).
- COUNT for 1s. If the I1 signal is above .01 V (1000), repeat step 6. If it drops below this value, stop.
- MOVE ZEE -0.8mm (relative move).
- SCAN ZEE vs. I1 (-.4mm to 1.0mm, relative, 0.1mm steps).
Note the highest count rate. Accept the first position in the scan which is less than half that value.
- SCAN THETA vs. I1 (-5° to +5°, relative, 0.25° steps)
This result is likely to be a trapezoid. Locate the center. Move ZEE to this position.
- MOVE ZEE -0.5mm relative.
- COUNT for 1s. Write down the I1 value.
Close TBLTOPJAW1 so it blocks direct beam…
- MOVE TBLTOPJAW1 -0.1mm, relative.
- COUNT for 1s. Repeat steps 13 and 14 until the I1 signal drops by 20%.
- MOVE TBLTOPJAW1 +0.2mm, relative.
- MOVE ZEE +0.5, relative.
- MOVE ZEE +0.1mm, relative.
- COUNT for 1s. If the I1 signal is above 0.01 V, repeat step 18. If it drops below this value, stop.
- MOVE ZEE -0.25mm, relative.
- SCAN ZEE vs. I1 (-.4mm to 1.0mm, relative, 0.1mm steps).
Note the highest count rate.
Accept the first position in the scan which is less than half that value.
Align Sample THETA
- SCAN THETA vs. I1 (-.5° to +.5°, 0.1° steps). This result is also likely to be a trapezoid.
-
Locate the center. Move THETA to this position.
.
- SCAN ZEE vs. I1 (-0.15mm to 0.15mm, relative, 0.01mm steps).
Note the highest count rate. Average this with ±2 points in each direction.
Note the lowest count rate. Average this with ±2 points in each direction.
Accept the position in the scan closest to the average of these two values.
- SCAN THETA vs. I1 (-.2° to +.2°, 0.01° steps)
Accept the max value. If a trapezoid is obtained, then go back to step 21b.
- The sample is now aligned.
- Exit XAS_Collect
- RESET THETA to zero: Type, “ICS_CONF”; Hit, [ENTER]; Backspace and type in value of 0; Hit [ENTER]; Type, “e”, to exit.
- You can now start XAS_Collect.
Continue to Next step
GI-EXAFS Measurement Setup
The user must know what type of measurement they plan to run, GIXAFS, Reflectivity, etc.
- MOVE TBLTOPJAW1 and TBLBOTJAW1 to 2mm for reflectivity measurements. For XSW and GI-EXAFS, move them each to 8 mm.
- The system is ready for reflectivity scanning or XSW measurements
(2THETA motor scans and .DET files).
- MOVE 2THETA (relative or absolute move) to the critical/incident angle (typically ~0.15ş for oxide and Si substrates, ~0.28ş for metal substrates).
- Before you start your scan, you may wish to scan THETA and look at the Fluorescence yield to make sure that you are near the optimimum position.
- The system is ready for GI-EXAFS scans (MONO motor scans and .DET files).
Continue to Next step
Check Detector Counts
- CHECK COUNTS: Detector->Current->Counts->next device module (ICR counts should be < 200,000 counts/sec)
- To decrease counts, MOVE MONHGAP to smaller values. To increase counts, MOVE MONHGAP to larger values.