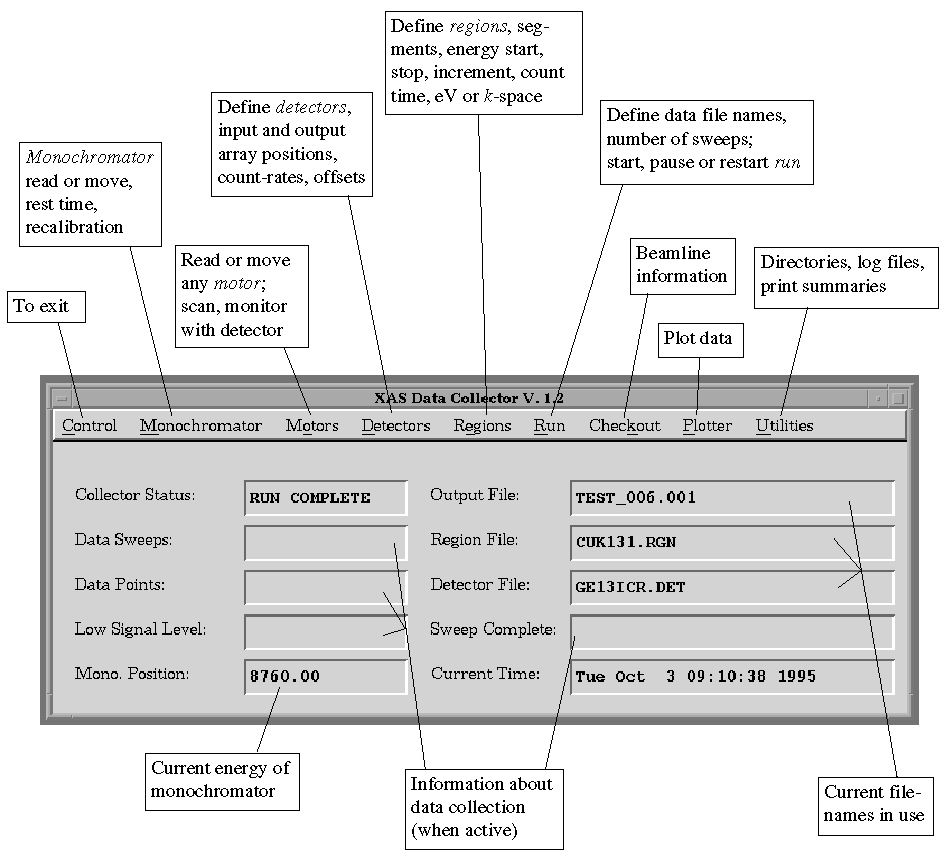
Figure 1. XAS-Collect Window
XAS-Collect
A Program for X-ray Absorption Spectroscopy
Data Collection
Users' Manual for XAS-Collect V.1.2
Acknowledgments
The program XAS-Collect was written by Martin
J. George, Scientific Programmer at SSRL. Conceptual design was by Martin
George together with Drs. Graham N. George, Ingrid J. Pickering and Britt
Hedman, Staff Scientists at SSRL. We are grateful to the many XAS users
of SSRL who provided input during the design and testing of the program.
This manual was written by Ingrid Pickering, with input from others.
The Stanford Synchrotron Radiation Laboratory (SSRL), a department of the
Stanford Linear Accelerator Center, is operated by the Department of Energy,
Office of Basic Energy Sciences. Support for research by SSRL staff is
provided by that Office's Division of Material Science. The SSRL Biotechnology
Program is supported by the National Institutes of Health, Biomedical Research
Technology Program, National Center for Research Resources. Further support
is provided by the Department of Energy, Office of Biological and Environmental
Research.
Further Information
We value your input on this and related programs,
as well as other aspects of XAS experimentation at SSRL. For queries or
further information, please contact one of the people listed below:
| For queries regarding: | Please contact: |
Telephone: |
E-mail: @ssrl.slac.stanford.edu |
| Conceptual issues, future developments, experimental specifics | Graham
George Ingrid Pickering Britt Hedman |
4604 |
GEORGE |
| Manual additions or corrections | Ingrid Pickering |
4558 |
PICKERING |
| SSRL computer accounts | Ellie Fazli |
3038 |
FAZLI |
| SSRL beamtime requests | Suzanne Barrett |
3191 |
BARRETT |
| Programming and function | Martin George |
3964 |
MGEORGE |
Table of
Contents
A. Getting Started
B. Getting Around the Interface and Windows
B.1. Introduction to the Toolkit
B.2. The Interface and Plotter
B.3. The Windows
C. Quick Hints for Starting an Experiment
D. How to Use the Plotter
D.1. Using Standard Plots
D.2. Using Plot Groups
D.3. Plotting Using Non-Standard Detector Files
E. Description of Menu Items
E.1. Control
E.2. Monochromator
E.3. Motors
E.4. Detectors
E.5. Regions
E.6. Run
E.7. Checkout
E.8. Plotter
E.9. Utilities
F. The Plotter
F.1. Definitions
F.2. Files
F.3. Setup
F.4. Zoom
F.5. Manipulate
F.6. Print
G. Program, File and Directory Structure
G.1. Program Organization and Control
G.2. Data File Structure
G.3. Files and Directories Used by XAS-Collect
G.4. Detector File Masters
H. XAS-Collect Utilities
H.1. XAS
H.2. XAS_ASCII
H.3. XAS_LIST
I. Basic Guide to Beamline Computers
I.1. Beamline workstations
I.2. Disk quotas and disk space
I.3. Backing up to SSRL
I.4. Backing up to tape
I.5. Useful SSRL utilities
A.
Getting Started
At the $ prompt in a DECterm window, type:
XAS
The XAS Data Collector window will appear. This is the main XAS-Collect
interface window. The central part of the window contains information about
the experiment, and the "menu bar" at the top of the window lists
various options, which are summarized in Figure 1:
Figure 1.
XAS-Collect Window
B. Getting
Around the Interface and Windows
B.1. Introduction
to the Toolkit
XAS-Collect utilizes low level X Windows graphics for optimal
speed on MicroVAX computers. The toolkit, viz. the windows, buttons,
fields, scrolling lists, etc. have all been custom-programmed by
Martin George, scientific programmer at SSRL. In designing them, attention
has been paid to making them as consistent as possible with other window-style
operating systems commonly in use, such as Apple MACintosh, MicroSoft Windows,
OSF-Motif, etc.
B.2. The Interface
and Plotter
Using the Mouse:
The left mouse button is used to select items in the windows.
In the main interface and plotter windows, a single click on an item in
the menu bar will "pull down" the menu. If the mouse is used
to move the cursor down the menu, menu items become highlighted when the
cursor is over them. Select the menu item by clicking on the menu item.
Alternatively, clicking on the menu bar, dragging the cursor to the required
menu item then releasing will have the same effect.
If the mouse button has been depressed on a menu item and then the cursor
is moved and the button is released outside of the menu, the menu item
will not be called. To "put away" the menu, click anywhere in
the window which is not part of the menu bar.
Using the Keyboard:
Each menu in the menu bar has a letter underlined, which corresponds
to an accelerator key. To pull down the menu using the keyboard, depress
the "Alt" or "Compose Character" key and then type
the underlined letter, e.g. Alt-m for Monochromator. Once a menu
is popped down, type the underlined letter to select the option, e.g.
m for Monochromator Move. Alternatively, use the up/down arrow keys to
move within the menu and the left/right keys to move between menus. Select
the menu item using "Return" or "Enter".
B.3. The Windows
An example window is shown in Figure 2.
Using the Mouse:
Use the left mouse button to select a toggle or radio button, to move
to an editable field, or to execute a command using a function button.
Using the Keyboard:
The currently active window item is highlighted with a bold border.
To select the active item, simply hit "Return" or "Enter".
Within a window, items such as buttons or fields are arranged in groups;
a group has a thin line encompassing its items. To move between the items
in a group, use the cursor keys. To move between groups:
Tab - to move between the most commonly used items
Shift-Tab - to move between all allowable items
Shift-Lock - reverses the direction of movement
Accelerator keys can also be used to execute the functions displayed by
the function buttons. Depress the "Alt" or key and then type
the underlined letter.
Inserting/overwriting text: in an editable field, characters are normally
inserted before the position of the cursor. To toggle to overwrite,
press the "Insert" button on the keyboard, and vice versa.
White text on a button or menu item indicates that that function is not
currently available, e.g. Run => Stop Run is not available unless
a run is currently in progress.
Red text in a label means that an item is not correct, or not yet implemented,
e.g. read text when entering a region in the Motor Scan window indicates
that the values are not yet consistent, and "Apply" should be
selected.
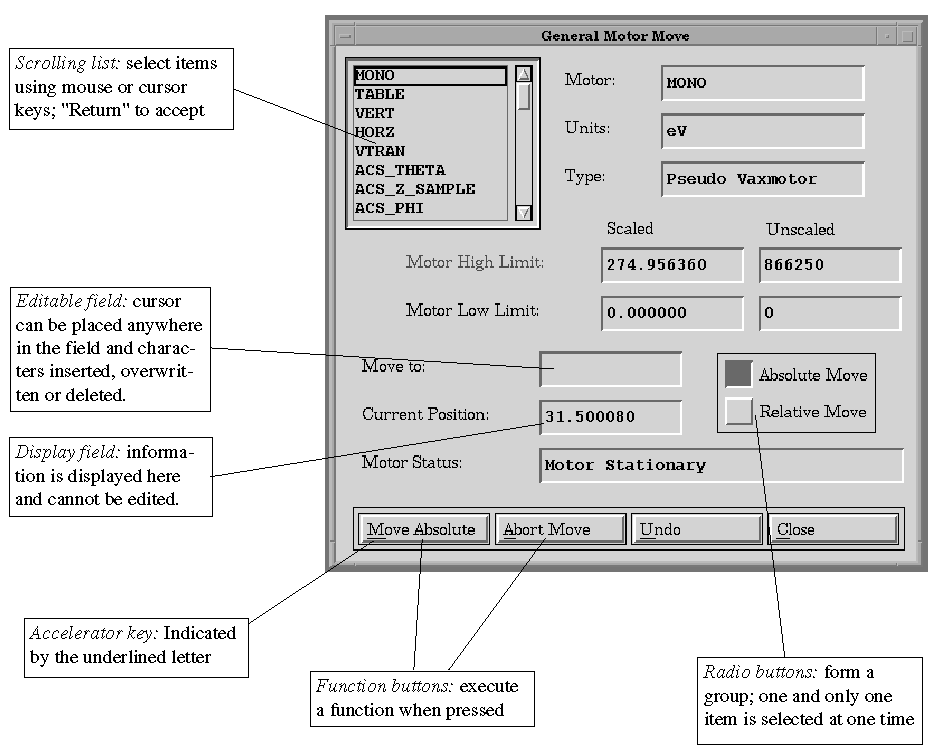
Figure 2. Example Window From XAS-Collect
C.
Quick Hints for Starting an Experiment
This section gives a brief overview of how to use XAS-Collect
to initiate an experimental data collection run. For a fuller description
of a menu item, refer to section #E .
1. Launch XAS-Collect by typing XAS
at the $ prompt
2. Change energy to required position
above the absorption edge (e.g. to de-tune)
Use , select "Absolute Move" toggle, enter desired energy, select
"Move Absolute" .
3. Open detector file (only if desired
filename does not appear in "Detector File" field of interface)
Use , choose filename, Ok, Apply, Make Current.
Filename will appear in the "Detector File" field of the Interface.
4. Open regions file (only if desired
filename does not appear in "Regions File" field of interface
window) :
Use , choose filename, Ok, Apply, Make Current.
Filename will appear in the "Regions File" field of the Interface
5. Align table by using :
Choose "Select Devices" and select Table as Scan Motor and I0
as Scan Detector. In the Scan Motor window, select "Relative Mode"
and input Start, Stop and #Pts. as (e.g.) +1.5, -1.5 and 21, respectively.
If the message "Warning - scan defined will move AGAINST BACKLASH"
appears, reverse the direction of the scan. Select "Start Scan"
to begin; as the data points are collected, they will be plotted in the
drawing area (note that it may take several seconds for the table to move
to the start of the scan, due to its fine increment of step). When the
scan is finished, the motor will return to its original position, and "Scan
Complete" appears in the message window.
Use the cursor and the right mouse button to visually choose the optimum
alignment position. Click on Accept Pos. to move to the chosen value.
6. Align sample positioner :
If a motorized sample positioner is available, proceed as for align table
but select the relevant motor (e.g. VERT1), and appropriate relative
Start and Stop values for the sample (e.g. for a vertical sample
size of 4 mm, scan -3 to +3 if sample is already roughly aligned; use greater
range if just setting up).
7. Set up detectors using :
Check count-rates (especially for solid state detectors): Select
"Counts", count time 1 s., with beam on. Use "Next Device
Module" to cycle through the channels. Note that collecting Counts
does not affect the stored darkcurrents (offsets) for the detectors.
Collect darkcurrents: Select "Offsets", count time 10
s., with beam off. Use "Next Device Module" to cycle through
the channels. Note that collecting Offsets automatically overwrites the
detectors file, and the values are automatically written into the data
file.
Collect statistical weights (only for multi-element detectors):
Ensure that "Statistical Weighting" is on for each channel of
interest (e.g. all the fluorescence channels). Select "Weights",
then check that Mono. start and Mono. end correspond to points below and
above the edge, respectively. Apply, then Close, Save to File, choose filename,
Make Current.
Check low signal wait instructions: From Detector File Editor window
select "Apply", then select the action to be taken on recovery
of beam after loss. Select "Save to File" choose filename, then
"Make Current".
8. Check monochromator rest time.
9. Start run :
Enter the output filename (e.g. for output filename MYNAME, the
full filename will be MYNAME_nnn.mmm, where nnn is the run number and mmm
is the sweep number). Enter the required number of repetitive sweeps, and
any comments to go into the data file. Apply, Start Run.
To change number of sweeps while run is in progress use .
To stop the run prematurely, use , then:
Stop Run Now: to abort this scan cleanly after current data point
(e.g. bad data).
Panic Abort: to abort ONLY in an emergency.
Stop at sweep end: to end run cleanly at end of sweep (equivalent
to , ).
10. Plot data using
Use (, p.) then "Plot Group". See section xx for a guide on and
section ,xx for a description of the menu items.
D.
How to Use the Plotter
This section is designed to give a brief overview of how
to use the plotter in XAS-Collect. For detailed information on specific
menu items, please refer to section , p. .
D.1. Using Standard
Plots
A standard plot is the definition of which
array positions to plot, how to scale the plot and which color, linestyle
and/or pointstyle to use for each trace within the plot. Examples of standard
plots are an I0 plot, and the sum of all fluorescence channels
of a multi-element detector divided by I0. The definitions of
standard plots are saved in a standard plot file.
The remainder of this section applies to standard detector files, i.e.
those for which the number and order of the array positions is the same
as the master from which it was created (see Table , p. ). For non-standard
detector files, refer to section below.
D.1.1. Plotting using a standard plot
Use () or () to launch the Define Plot window. Select the name
of the standard plot from the scrolling list on the right, then select
the "Plot Std." function button.
D.1.2. Customizing array positions for an existing
standard plot
Create a plot as described above, then select and choose the
desired plot to modify. Use the Specify Plot window to change array positions
(see , p.), then select "Save to std." and "Overwrite"
and the name of the standard plot will appear in the text field below.
Alternatively, with "Overwrite" off, enter a new standard plot
name. Finally, select "Apply", which will save the changes to
the standard plot file.
As an example, one element of a multi-element detector (e.g. array
position 12) is not functioning at all and it is desirable to exclude its
signal from the sum of fluorescence channels used in the standard plot
called "sum (FF/I0)". In the Specify Plot window, select Ordinate
Y, then in the the Numerator Array Positions field type "-12"
and hit "Return". Select "Save to Std.", enter "sum
(FF/I0) -12" in the field below, and select "Apply".
D.1.3. Creating a new standard plot
Use () or () to launch the Define Plot window. Select "Specify
Plot" then use the Specify Plot window to enter the array positions
and other definitions for the plot (see , p.). When done, select "Save
to std." and enter a new standard plot name in the text field below.
On selecting "Apply" the new plot will appear and the standard
plot definitions will be written to the standard plot file.
D.1.4. Deleting a standard plot from the standard
plot file
Select (see , p. ) and in the Standard Plots window select from
the left-hand scrolling list the detector file of interest and hit "Return".
The middle field will show the standard plot file associated with the detector
file (usually the same name with .PDF extension). The list of standard
plots for that file are shown on the right-hand side. Select the standard
plot to be deleted and then use the "Del. Std. Plot" button.
D.1.5. Changing standard plot attributes
To change the scaling or linestyle of a standard plot, select
(see , p. ) or (see , p. ), respectively. Make the desired changes to the
plot as displayed and when finished select "Apply" which will
save these attributes to the standard plot file.
Subsequent plots using the specified standard plot will have the same color
and linestyle. They will be scaled in the same way if the same region file
is in use.
D.2. Using Plot Groups
A plot group is a list of standard plots which
can be plotted using a single button press. Often XAS experiments involve
the same measurement on a group of related samples and therefore it is
desirable to plot, for each run, the same set of plots.
F.2.1. Plotting the default group
Use () or () to launch the Define Plot window. Select "Plot Group"
and the default group of plots will appear.
D.2.2. Customizing the plot group
Use (, p. ), select the standard plot filename from the list
at left and select "Open File". For each of the standard plot
names in the list at right, select "Off", "Single Sweep",
"All Sweeps ON" or "Average". When finished, select
"Save Changes".
D.2.3. Changing attributes of plots within a group
The attributes of plots within a group are changed by changing
the standard plot attributes.
D.3. Plotting Using
Non-Standard Detector Files
A non-standard detector file may have:
a) The same number of array positions, but one or more of their assignments
have changed. In this case the default standard plot file will still
function to generate standard plots; however, caution should be exercised
as the standard plots may not be what is expected. If necessary, proceed
as for b).
b) A different number of array positions. The default standard plot
file will not work and must be replaced. Use (, p. ), select the detector
filename from the list on the left and hit "Return". In the center,
erase the field containing the old standard plot file name and enter a
new name (recommend the same name as the detector file with .PDF as extension).
Hit "Return" and then select "Add/Replace Std.".
Now proceed as for to create new standard plots and to customize the plot
group.
E. Description of Menu
Items
E.1.
Control
E.1.1. Control => Exit
To exit the program. The Program Shutdown window will appear, in
which the Collector Status is displayed. Confirmation is required before
the program is terminated; if data collection is in progress, there is
the option to exit the Interface and leave the Data-Collector running (in
which case the Data-Collector is not interrupted), or to exit the Interface
and abort the data collection. "Cancel" returns to the interface.
E.2. Monochromator
E.2.1. Monochromator => Move
To move and read the monochromator. The current
energy position of the the monochromator is shown in eV. The first field
is editable to input the requested position for the move. If the requested
position is out of range, the move will not be made. One can toggle between
absolute and relative move, both measured in eV, and the function button
reflects the toggle by displaying Move Absolute and Move Relative. Absolute
move is most commonly used; relative move is useful for moving repetitively
in small steps. "Abort Move" stops the monochromator in the middle
of a move; "Undo" will return it to the previous position (only
one level back), either from its aborted state or after finishing successfully.
"Region Summary" calls up the Region Summary window which displays
the start and end energies of the current region and constituent segments
(see , p.). "Close" finishes with this window.
E.2.2. Monochromator => Calibrate Mono.
To reset the energy of the monochromator. As an example,
a scan of copper foil shows the first energy-inflection to be 8981.1 eV,
whereas the tabulated inflection is assumed to be 8980.3 eV. In order to
calibrate the monochromator, it should first be moved to the observed edge
position (8981.1 eV); from within this window select "Modify Position",
select Absolute Move and type 8981.1 in the Move to (eV) field, then select
"Move Absolute". Next, in the Calibrate Mono. window, input 8980.3
as the Calibration Point eV and select "Apply". A confirming
window will appear - select "Apply" to complete the calibration,
"Cancel" to discontinue. "Undo" in the Calibrate Mono.
window will undo the calibration (one level back).
E.2.3. Monochromator => Rest Time
To read or change the rest time for the monochromator,
(i.e. the time to wait after the motors finish moving, before starting
the collection of the data point). Current rest time is displayed; New
rest time field can be edited. "Apply" makes the change; "Undo"
returns to previous value, even if the window has been closed since it
was last changed.
E.2.4. Monochromator => Display
To display various monochromator parameters, including
VAXmotors names and limits, and crystal cuts and d-spacings. Parameters
in this display can be changed under (, p.).
E.3. Motors
E.3.1. Motors => Move
To read and move any motor. Motors are pre-defined
in a default beamline motors file. If the default motors do not appear
in the scrolling list, then use (see , p.) to retrieve them. Select a motor
from the scrolling list. Its units, type and scaled and unscaled limits
are displayed (see Figure 2). The current position of the motor (in scaled
units as specified) is shown. The Move to: field is editable to input the
requested position for the move. If the requested position is out of range,
the move will not be made. One can toggle between absolute and relative
move and the function button reflects the toggle by displaying Move Absolute
and Move Relative. "Abort Move" stops the motor in the middle
of a move; "Undo" will return it to the previous position (only
one level back), either from its aborted state or after finishing successfully.
"Close" finishes with this window.
E.3.2. Motors => Scan Motor
To scan any motor and monitor the effect it has using any
detector channel. See Figure 3. A current detector file must previously
have been chosen (see , p. and , p.).
Figure 3. Scan Motor Window
First, choose Select Devices (at top left) to
specify the motor and detector. On highlighting the motor in the scrolling
list it will appear in the "Motor:" field; next, choose the "Select
a Scan Detector" toggle and then select the detector from the list.
Select "Apply" when done.
Next, set up a scan region: choose Relative (with respect to the current
position) or Absolute Mode. Note that the motor will return to the current
value on completion of the scan. Enter values in the Start and Stop fields,
and either the Increment or the # Points (the labels for these fields will
be colored red) then select "Apply". Provided the inputs are
valid, the value for the remaining field will be computed from the others,
and the labels will return to black.
If the message "Warning - scan defined will move AGAINST BACKLASH"
appears, this means that the current scanning direction of the the motor
will create a large overhead in motor movement to achieve the scan. It
is still possible to scan in this direction if desired; however, it is
recommended that the direction of the scan be reversed (e.g. instead
of a relative scan from -2 to +2, scan from +2 to -2 with a negative increment.
If the entries are valid, then select Start Scan. If the computer detects
that there is low beam (the low signal channel registers below its threshold
value) then a warning will be issued before commencement (in case the shutters
have inadvertently been left closed). As the scan is executing, the counts
vs. the motor position will automatically be plotted, with the x-axis
scaled according to the scan range and the y-axis autoscaling. The
scan can be stopped prematurely in two ways: Stop Scan will return the
motor to the original position, whereas Abort will stop the motor where
it is.
On completion of the scan, clicking with the cursor in the plotting area
will display a cross-hair and show the position and intensity in the "Move
Position" field. The cross-hair can be used to visually estimate the
optimum alignment position for the motor; if preferred, a value may be
typed in the "Move Position" field. When satisfied, select "Accept
Position" and the motor will move to the chosen position. "Abort"
will abort the move and "Undo" will return to the previous position.
"File" will save the scan x, y coordinate set to an ASCII
file for plotting or processing outside of XAS-Collect.
The plots of successive scans will overlay; select "Clear" to
clear the plotting area. "Print" will make a hardcopy of the
plotting area.
E.3.3. Motors =>
Setup Motor
To view motor parameters, and to add or delete
a motor, such as a sample positioner, from the list of motors.
To view the list of motors and their parameters using this menu,
select Mode: Display and then move within the scrolling list of motors.
To delete a motor, select "Mode: Edit" and "Mode:
Delete", select the motor from the scrolling list, and select "Del.
Motor".
To add a motor, select "Mode: Edit" and "Mode: Add",
enter the (VAXmotor) motor name (e.g. VERT1), select the units (e.g.
mm) and select Real (simple motor) or Pseudo (combination motor). If this
is a pseudomotor (i.e. a motion composed of more than one independent
motors, e.g. the pseudomotor MONO is composed of CRYSTAL plus TABLE)
then add the name of the limiting motor (in this case CRYSTAL). When satisfied,
select "Add Motor". Note that the motor name must already have
been defined in ICS or equivalent.
E.4. Detectors
H.1.1. Detectors => Create
To define a new detector file from a list of standards, for example
when using a new detector arrangement for the first time. It is not possible
to create a new detector file completely from scratch; instead, a selection
of master detector files is provided for users' convenience, which can
then be customized. Using this option, a selection of detector files in
a master location is accessed, one of
which will be copied into the user's detector file directory for subsequent
editing. Select the required master file from the list; the top two lines
display information about the contents. Type a New File Name (can be the
same as the master file name; the default extension for a detectors file
is .DET) then select "Ok". The Detector File Editor window will
appear; see section for details.
E.4.2. Detectors => File
To examine and edit detector attributes. A scrolling
list of detector files is displayed; select one and then select "Ok".
The Detector File Editor will appear (see Figure 4). Detector channels
are input using device modules (typically CAMAC hex scaler modules). Switch
between modules using the "Next Device Module" and "Prev.
Device Module" buttons. The Module Type (e.g. Hex Scaler, Real
Time Clock), and No. of Elements (e.g. 6 for hex scaler) are displayed.
Labels are assigned to each channel for purposes of identification
within the program and in the output data file, e.g. I1, FF3, and
may be edited. Click on "Label", then select the module and module
element of interest, then edit the "Array label" field as desired.
Sequence defines the order in which detector channels are written
to the data file. To display the sequence, click on "Sequence";
to edit select the module and module element of interest, then edit the
"Array position" field as desired. The sequence can be different
from the order of channels in the device modules. The sequence numbers
need not be contiguous, but must not be duplicated. As an example, both
a Lytle detector and a 13-element germanium detector are used in an experiment,
and the Lytle detector is cabled to the last hex scaler channel after all
13 Ge detector fluorescence channels, whereas it is desirable in the output
file to list it before the Ge channels. If the Lytle is given the sequence
number 7 and the Ge channels the sequence numbers 11 and upwards (for example),
the data will be written to the desired array positions.
Figure 4.
Detector File Editor
Chan. On/Off can be used to stop a detector
position being written to the output file. Click on the "Chan. On/Off"
function button to view the status of the channels. To change status between
On and Off, select the module and module element of interest, then use
the "Channel On/Off" toggle button. To use the same example as
the "Sequence" paragraph above, for one data set it is desired
to collect just Lytle fluorescence. Without recabling the hex. scalers,
this is possible simply by switching off the channels corresponding to
the Ge detector. Note that the sequence numbers do not change if a channel
is Off, whereas the data file will no longer contain that array position.
Counts can be used to determine count-rates on all the detectors.
With shutters closed, click on "Counts", enter a Count Time (e.g.
1 s.) and click on "Ok". Counts will be collected for all the
detector elements essentially simultaneously. Using "Counts"
does not change the stored Offsets (darkcurrents).
Offsets (darkcurrents) will record the background count-rate for
all detectors, which will be automatically subtracted from the count-rates
at each data point before the data is written to the data file. The values
of the offsets are also written to the data file header for reference.
Click on "Offsets", enter a Count Time (e.g. 10 s.) and
click on "Ok". Offsets will automatically overwrite the previous
values and will be used for subsequent data collection. Offsets should
be recollected periodically.
Weights are used for multi-element detectors such as the 13-element
germanium detectors. Each element has a slightly different response, due
in part to different distances from and solid angles subtended at the sample.
Therefore, it is desirable to weight the contribution of the channel to
the average in proportion to its signal-to-noise.
Weights are ideally collected on a sample before beginning a run. In the
Stat. Weighting window, check the I0 array position and the
energy positions for below and above the edge (Mono. start and Mono. end);
the program uses the information from the current region file to estimate
these energy positions. When correct, select "Apply": the monochromator
will move to each of the positions and count for the time requested (typically
10 s.).
Summary will produce a list of the output file array positions and
corresponding labels.
On selecting "Apply", the Detector File Header window appears,
which contains comment lines and low signal wait instructions. The low
signal wait options send instructions to the collector in the event that
beam goes away, and are enabled/disabled using the Low Signal ON/OFF toggle.
Specify an Array No. for Low Signal (conventionally channel 4, I0)
and the threshold level in counts below which a low beam condition exists
(typically 2000). Also enter the resume instructions, including how long
to wait (this delay is intended to account for a short period of beam instability
during steering operations) and how to resume (i.e. restart sweep,
or resume sweep, or skip to next sweep).
From this, the region can be "Saved To File" as a new filename,
or saved to the old one. Once it has been saved, "Make Current"
can be invoked: this detector file will now be used in data collection
and the filename will appear in the "Detector File" field of
the Interface window.
E.4.1. Detectors => Current
To examine current detector attributes. The Detector
File Editor window (see Figure 4) appears with the current detector file
selected; functionally this is the same as except that the parameters cannot
be changed while a run is in progress.
E.5. Regions
E.5.1. Regions => Create
To create a new regions file from scratch, or using the
auto region generator.
The Auto Region Generator will create a default EXAFS region using
the element and edge type together with other typical parameters. The default
region has three segments: a pre-edge segment, with 22 points spaced 10
eV apart; an edge segment, from (E0-40.0) to (E0+10.0)
eV, with point
spacing of 0.35 eV; and a k segment to k=16.2 Å-1.
These parameters can subsequently be edited to tailor the region to specific
requirements.
If the Auto Region Generator is chosen, enter the desired element
symbol (e.g. Cu) in the Element: field of the Automatic Region window
and select the type of edge. On hitting return, or selecting "Search",
the tabulated reference edge energy will be displayed. EXAFS data are conventionally
collected in k-space, which requires a value of E0, the
energy for k=0. E0 is often chosen to be offset from
the foil value by about 20 eV; the required offset can be entered, and
optionally E0 is rounded to the nearest 5 eV. On selecting "Apply",
the program will generate the default region.
See section for a description of the Region Editor.
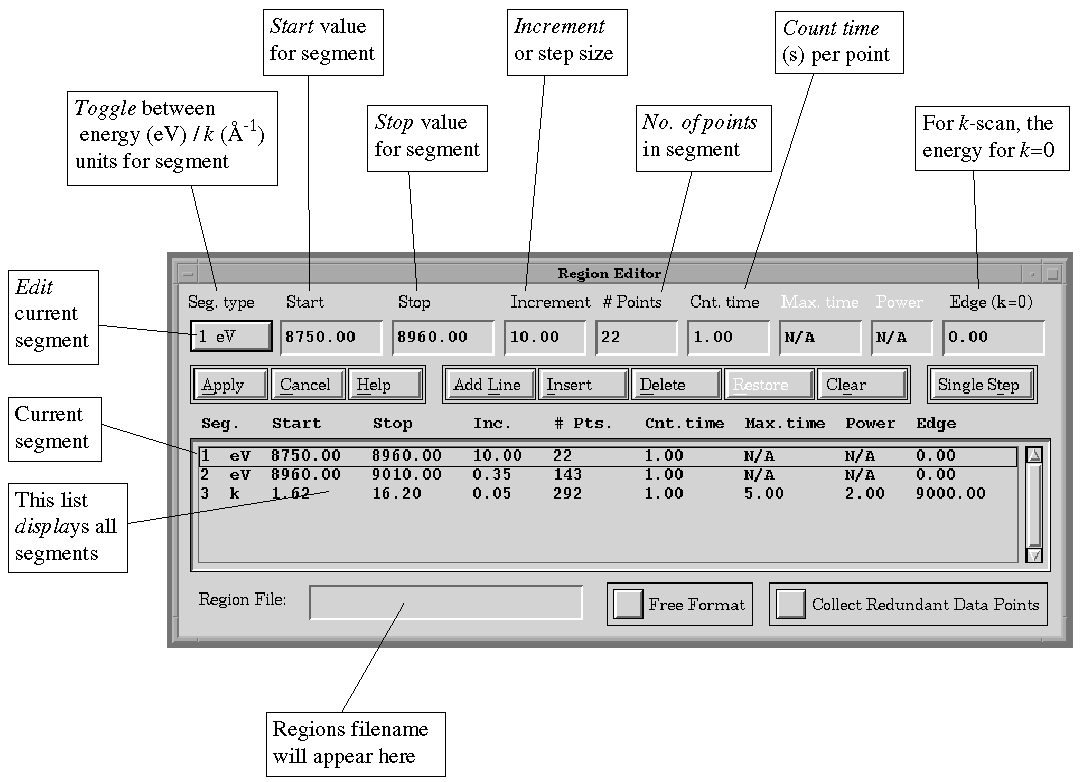
Figure 5.
Region Editor
E.5.2. Regions => File
A file selection box will appear to choose from existing regions
files. The default extension for a regions file is .RGN.
The central portion of the Region Editor window (see Figure 5) displays
the various parameters of all the segments in the current region as separate
lines in a scrolling list. The parameters are as follows: Segment
is the index of the segment; type which defines whether the scan
is in units of energy (eV) or k (Å-1); the start
and stop of the segment, the increment (stepsize) and the
corresponding number of points in the segment. For an eV scan, the
count time applies to each data point in the segment. For a k
scan, the time can be ramped to give longer counting times towards the
end of the
scan. The count times t(k) are computed using t(k) = c +
mkn , where n is the segment power, and c and
m are constants calculated from the Min. time and Max.
time and the start and stop values of k.
A single selected line from the scrolling list appears in the fields across
the top and is available for editing. The "Seg. type" button
permits toggling between eV and k if an edge energy has been defined.
If Increment or # Points is changed (and "Return" is hit), then
the other value will be recalculated.
Note that, when using fixed format ("Free Format" button
out), the collector will reject redundant points, such as the apparent
overlap between the end and start of regions, and if the increment is smaller
than a single step of the monochromator. The region editor will constrain
the segments to be contiguous (i.e. no gap or overlap between them),
with positive increments and only using energies within the defined limits
of the monochromator. Free format (button in) removes these constraints,
permitting zero or negative increments, overlap or gaps, etc. It
is recommended that fixed format is used for generating all standard XAS
regions. The Collect Redundant Data Points option will allow multiple data
points to be collected at the same monochromator position. The standard
setting of this is off.
On selecting "Apply", the Region Summary window will appear,
with information on duration and extents of the region. From here, the
region can be "Saved To File" as a new filename, or saved to
the old one. Once it has been saved, "Make Current" can be invoked:
this region will now be used in data collection, and the filename will
appear in the "Region File" field of the Interface window.
E.5.3. Regions => Current
The current regions file is displayed in the Region Editor window
(see ). If parameters are edited while a run is in progress, the region
cannot be saved to the same file name.
E.6. Run
E.6.1. Run => Start Run
The Define Run window appears. The first two fields, "Detector
File" and "Regions File" should contain the desired filenames.
If they do not a run cannot be started, and these files should be selected
(see , p. and , p.) before proceeding. The "Run No." (between
1 and 999) will automatically increment with each new run, but can also
be edited if required. The complete output filename will be MYNAME_nnn.mmm,
where MYNAME is the string entered in the "Output Filename" field,
nnn is the run number and mmm is the sweep number. Enter the "No.
Sweeps" which is the number of repetitive scans having identical parameters,
and can be between 1 and 999. Note that a "sweep" is a single
pass through the energies defined by the region and that the data from
each sweep is written to a separate data file. Information entered in the
six "Comments" lines will be written to the data file header
for each sweep. On selecting "Apply", the complete filename will
appear if all entries are valid, together with information about estimated
times of duration, and the "Start Run" button will become active.
If it remains white, then check the entries and the detector and regions
files. "Start Run" will start the execution of the run.
E.6.2. Run => Modify Run
To change the number of sweeps for a run which is already
in progress. The total number of sweeps can be decremented as low as the
value of the current sweep, in which case the run will end at the end of
the current sweep. It can be incremented to any number below 999.
E.6.3. Run => Stop Run
Three options are available, each requiring confirmation before
execution:
Stop Run Now will pause the scan cleanly after current data point.
Use this option to stop the scan, e.g. if a parameter needs to be
adjusted, or in the event of a beam dump. Once the run has been paused,
choose between the options of aborting the run completely, restarting
the sweep at the next point, or repeating the current sweep.
Panic Abort should ONLY be used in an emergency, such as if collision
of equipment is imminent. It will abort the sweep and run instantaneously,
including if a motor is in the middle of a move.
Stop at Sweep End will end the run cleanly at end of this sweep.
Restart options of repeat current sweep, restart at next sweep,
or end run are offered once collection is paused. The latter option
is equivalent to () and decrementing to the value of the current sweep.
E.7. Checkout
E.7.1. Checkout => Display
Displays various beamline parameters. If the "Beamline"
number is changed, then the option is given to retrieve the default beamline
motors. Mode (e.g. focused) and Wiggler (T) can be edited, as can
the Monochromator crystal type (e.g. Si(220)) and cut (e.g.
-6). These parameters will all be written to the data file header. The
rest of the parameters are all obtained from VAXmotors and cannot be changed
within XAS-Collect.
E.8. Plotter
E.8.1. Plotter => Start Plotter
To start the plotter. For information on the plotter,
refer to Section , p..
E.8.2. Plotter => Close Plotter
To terminate the plotter.
E.9. Utilities
E.9.1. Utilities => Session Log
To record a log of the session.
E.9.2. Utilities => Directories
To customize the directories to be used. On the first
time XAS-Collect is run under an account, it is necessary to customize
all the directories. In this case the defaults should be used. Select "Apply";
if any directories do not exist, the interface will query whether the new
directories should be created. On the first occasion for a new experiment
on a previously used beamline, it is recommended that a new data directory
is created on the disk $DATA1 in order to keep data separate.
E.9.3. Utilities => Print Utility
To print contents of region files, detector files and experimental
information.
Gen. Info.: Prints general experimental information, including the
beamline, mode and wiggler field, the monochromator crystal type, cut,
d-space, steps per degree and current rest time. To add to the printout,
simply select the "Gen. Info." radio button and then select "Add
to Page".
Regions: Prints a specified regions file, including the filename,
one header line and the segment information (start, stop, increment, etc.)
as shown in the Region Editor window. To add to the printout, select the
"Regions" radio button, select the regions file of interest from
the scrolling list and then select "Add to Page".
Detectors: Prints a specified detector file. Two options are available,
Detector Summary which prints the header lines, the low signal wait instructions
and a summary of the devices used, and Detector List which prints a detailed
list of array positions and labels. To add to the printout, select the
"Detectors" radio button, select "Detect. Sum" or "Detect.
List", choose the detector file of interest from the scrolling list
and then select "Add to Page".
Any number of different files can be added to the printout, and will be
summarized in the scrolling list on the right. "Del. from Page"
can be used to remove an unwanted entry. When the list is complete, select
"Apply" to create the page(s), then "Print" to send
to a file, or a printer, or both.
F. The Plotter
Figure 6. Plotter Window
F.1.
Definitions
A trace is a single line in a plot. A plot
may have one or more traces. Two types of multi-trace plots are used: i)
all y numerators (especially for superimposing the data from
individual elements of a multi-element detector), and ii) all
sweeps (for superimposing different sweeps in a given run). The
trace name for i) is the corresponding array position,
and for ii) is the full filename with sweep number extension.
A plot is a trace or set of traces which are treated in the
same way, i.e. which array positions to plot and the scaling to
be used. A plot may be a single sweep, multiple sweeps of the same run,
or an average of sweeps from a given run. The plot name is
the filename for a single sweep, or the filename without extension for
multiple sweeps or an average.
A standard plot is previously defined information as to which
array positions to plot, how to scale the plot, which color, linestyle
and/or pointstyle to use for each trace within the plot. Examples of standard
plots are an I0 plot, and the sum of all fluorescence channels
of a multi-element detector, divided by I0. A lists of standard
plots can be saved in a standard plot file, which can be
linked to a detector file using (, p.).
A plot group is a list of standard plots which can be plotted
using a single button press. The plot group information is defined using
(, p.).
F.2. Files
F.2.1. Files => Open
To use a completed (i.e. not current) data file in a
plot or plots. A File Selection box will appear; select one data file (sweep)
then select "Ok". The Define Plot window will appear, indicating
the selected Run Name and Complete Filename as just chosen. The following
choices are available:
Plot Single Sweep will plot the sweep as specified in the file selection
box.
Plot All Sweeps will superimpose each sweep of the specified run
as an individual trace of this plot.
Plot Average will average all the sweeps of the specified run and
plot them as a single trace.
If Plot All Sweeps or Plot Average is selected, then specific
sweeps may be excluded from the plot by selecting them in the scrolling
list and clicking on "Sweep ON/OFF".
Three different types of plot can be used, as specified by the function
buttons. "Use Group" will plot several different standard plots
as previously defined (see , p.). "Std. Plot" will plot a single
standard plot which can be chosen by name from the scrolling list on the
right of the window. See section for a definition of standard plots. "Specify
Plot" allows the plot to be customized initially, and will launch
the Specify Plot window (see , p. for details).
F.2.2. Files => Current
To use the current data file in a plot or plots. Functionally
this is similar to except that the data file has already been chosen. If
"Save Cur." is selected, then after the run is completed the
plot will be converted from a current sweep and will remain plotted. Otherwise,
the plot will be deleted at the end of the run.
F.2.3. Files => Modify
To make changes to existing plots, including removing
them. The Modify Plots window appears. The scrolling list shows the plots
currently used; select the desired one from the list and then select "Ok".
The Specify Plot window identifies which specific array position combinations
will be plotted. The Abscissa X - Ordinate Y radio buttons toggle between
the specification of each of the axes. The numerator and denominator array
positions fields specify the array positions to be plotted as (numerator/denominator),
and is an interpreted string.
Examples of valid strings are shown below:
| String: | Translates to: |
| 7-19 7,8,9,10,11 7-11,13-19 7-19, -12 ,0 |
# 7 through 19,
inclusive #7 through 11, inclusive #7 through 11, then 13 through 19 #7 through 11, then 13 through 19 Cancel all before this on the line |
The labels of the array positions are shown in
the scrolling list.
Figure 7.
Specify Plot Window
F.3.
Setup
F.3.1. Setup => Linestyles
To change the color or type of lines or points, and to highlight.
Choose the plot number using the counter on the top left of the window.
The plot name and standard plot name appear in the central fields, top
two lines. For a multi-trace plot, choose the trace using the counter at
the top right. The trace name, identified by the array label, will be shown.
For a specific plot and trace, use the radio buttons to change the attributes
of the trace including whether to plot a line and/or points, the color
used for the trace, the type of line (solid, dotted, etc.) and the
type of point (dot, square, etc.).
The highlight button temporarily overrides the color choices previously
made and will display the selected trace in yellow, all other traces being
plotted in blue. On selecting All Colors, the colors will revert to the
previous choices. This option is especially useful if there are many traces
in the window, for example if individual elements of a multi-element detector
are being plotted.
Selecting an option will immediately be reflected in the display, and if
"Close" is selected without choosing "Apply", those
choices will stay in effect while this particular plot and trace are being
plotted. If "Apply" is selected, the choices currently made will
be saved to the standard plot file and will become the default choices
whenever this type of standard plot is subsequently used.
F.3.2. Setup => Scaling
To specify manual or automatic scaling for each axis
of each plot. Switch between the individual plots using the counter
at the top left. For each plot, either autoscale (plot full scale within
the plotting area) or manual scale can be chosen for both the x
and y axes individually. For manual scaling, type the required minimum
and maximum for the axis, hit "Return" with the cursor in the
field, then select "Apply". For multi-trace plots, the scaling
is applied to all the traces. If autoscale y axis is chosen, then
the minimum and maximum values will be set by the smallest and largest
values of all the traces collectively, rather than each trace individually.
The first time on a new experiment, all the plots are autoscaled by default.
If a standard plot is called a subsequent time with the same regions file,
then any manual scaling which has been applied will be used. If a different
regions file is used, then the plot will revert to autoscaling.
F.3.3. Setup => Position
To use the cursors to get x, y positions from the plot. Choose
the window in which the cursor is to be active (main window, or zoom1,
zoom2 or maths plot if present). Choose also the plot for which position
information is to be obtained (as different plots may well have different
scales), then select "Apply". The small Position Cursor window
will appear. When the left mouse button is clicked with the cursor in the
chosen plotting window, a cross-hair will appear on the plot and the x
and y positions of the cursor will be displayed in the Position
Cursor window. If a position from a different plot or a different plotting
area is required, return to the Setup => Position menu option to make
the new choices. Choose "Close Cur. Window" to finish with this
option.
F.3.4. Setup => Std. Plots
To associate standard plot files and standard plots with
a particular detector file. On the left side of the box, the scrolling
list displays all the detector files available, with the selected one appearing
in the field at the top. The center field and scrolling list show the standard
plot files available. The right hand field and scrolling list show the
list of standard plots available in the selected standard plot file. Standard
plot files comprise a list of standard plots to be associated with a particular
detector arrangement. The extension for a standard plot file is .PDF .
By default, the standard plot file will have the same name as the detector
file, e.g. TRANS.PDF to go with TRANS.DET, but any valid name can
be used.
Only one standard plot file can be associated with a given detector file
at one time. To Add or Replace a standard plot file associated with
a particular detector file, first select the detector file by clicking
in the scrolling list and hitting "Return" (the detector filename
appears in the field). Next, if an existing standard plot file is to be
used, select it from the scrolling list by clicking (the name will appear
above), or, if a new file is to be used, type the new name in the field
(including the .DET extension). When both names are correct, select "Add/Replace
Std." to make the association. To remove association with any standard
plot file, select the detector file and click on "Delete Std. File".
Use the "Del. Std. Plot" button to remove an unwanted standard
plot selected from the list.
F.3.5. Setup => Plot Groups
To specify which standard plots and which combinations of
sweeps appear with the "Use Group" command (see , p.). Select
a standard plot file from the scrolling list on the left and then choose
"Open File". Scroll through the list of standard plots on the
right, and choose for each standard a Single Sweep, All Sweeps ON, Average,
or Off (no plot) using the radio button. When finished, select "Save
Changes". Another standard plot file can then be chosen.
F.3.6. Setup => Axis Labels
To specify a plot title and axis labels. Labels may be
specified for the plotting window for the x and y axes and
a title to be printed across the top. Type the desired labels in the fields.
Individual label changes are made on typing "Return" with that
label selected; all label changes are made if "Apply" is selected.
"Close" closes the window without making any further changes.
F.4. Zoom
F.4.1. Zoom => Single Plot
To magnify an area on a single plot. In Select Zoom Plot
window, a scrolling list of the available plots will appear. Select one
from the list and the select "Apply". Then proceed as for .
F.4.2. Zoom => All Plots
To magnify an area on all the plots. The zoom area is
a rectangular box defined by any two diagonally opposite corners. To define
the area, position the cursor at one corner of the box, depress the left
mouse button and, keeping it pressed, move the cursor to the opposite corner,
then release it. The selected area will appear in a separate window, Zoom
Window 1 or 2. This window can be expanded or shrunk as desired.
F.4.3. Zoom => Close Zoom
To close the zoom window.
F.5. Manipulate
F.5.1. Manipulate => Manipulate Plot
To calculate a derivative, smooth, subtract a background
or calculate a Fourier transform. These options are intended to be
a tool in data collection, not as a substitute for data reduction.
In the Select Plot window, choose the desired Plot to use, and select from
the Plotter win (i.e. manipulated plot appears in the main plot
window) or Maths win (plot in separate window) radio button toggle. Next,
select the type of manipulation to carry out (i.e. derivative, smooth
or background subtraction).
Derivative: Specify the Start and Stop eV, the order of the derivative,
and the order of the polynomial and the smoothing energy range to be applied
to the data before the derivative is generated. Positive/Negative Peaks
should be chosen appropriately, e.g. for 2nd derivative, peaks in
the data correspond to negative peaks in the derivative. On "Apply",
the calculated derivative spectrum is displayed, together with lines showing
the position of peaks resulting from a peak search. The numerical values
of these peaks are also displayed in the scrolling list in the Specify
Derivative window. To browse amongst the peaks, position the cursor in
the scrolling list and move up and down using either the up/down arrow
keys or the mouse.
Background Subtraction: (See Figure 8). The pre-edge background
options are Polynomial (for transmittance or Lytle fluorescence data) and
Gaussian (for germanium detector fluorescence data at moderate energies).
For either, select the element and edge type ("Return" to enter)
and check that the Start and Finish values for the pre-edge are acceptable.
For a polynomial fit choose the order (a negative number means a function
of 1/E). For a Gaussian fit, choose values for the window energy (typically
the energy of the fluorescence), the window width and the detector energy
resolution. On selecting "Apply Pre-Edge", the resulting background-subtracted
spectrum will appear. To change the background, change a value and select
"Apply Pre-Edge" again.
Figure 8.
Background Subtraction and Maths Window
The lower portion of the Background Subtraction
window is concerned with the spline fit and subtraction. Values can be
changed for the polynomial order and the number of regions in the spline,
the spline points and k-weighting for the fit and the plot. On selecting
"Apply" the previous plot of background-subtracted data will
be erased and replaced with the EXAFS, plotted vs. k.
Fourier Transform: (Only available after having extracted the EXAFS
using background subtraction as described above). Specify the k-
and R-ranges for the calculation and press "Apply". The Fourier
transform will replace the EXAFS in the plot window.
F.5.2. Manipulate => Close Maths Win.
To close the manipulated plot window.
F.6. Print
To print a copy of the Main Window, or either of the
two Zoom windows. The Printer Output window will appear. If the "To
Queue" radio button is selected, then choose the postscript printer
queue from the scrolling list and on selecting "Apply" the plot
will be sent directly to that printer. If "To File" is chosen,
then enter a filename for the postscript output file in the "File:"
field and the plot will be written to a postscript file. "To Both"
will do both the above, and therefore both a printer queue and a filename
must be specified.
G. Program, File and
Directory Structure
G.1.
Program Organization and Control
XAS-Collect is comprised of two discrete programs, the User-Interface
and the Data-Collector. The User-Interface program is responsible for all
aspects of setup and display and its details are as described in this manual.
The Data-Collector is a smaller program which runs at a high priority (22)
and is responsible for the collection of data and the creation of output
data files. The Data-Collector only exists as an active program during
actual data collection. When the Data-Collector is active, Motors and Devices
are not accessible from the User-Interface program. A schematic of the
organization and control is given in Figure 9.
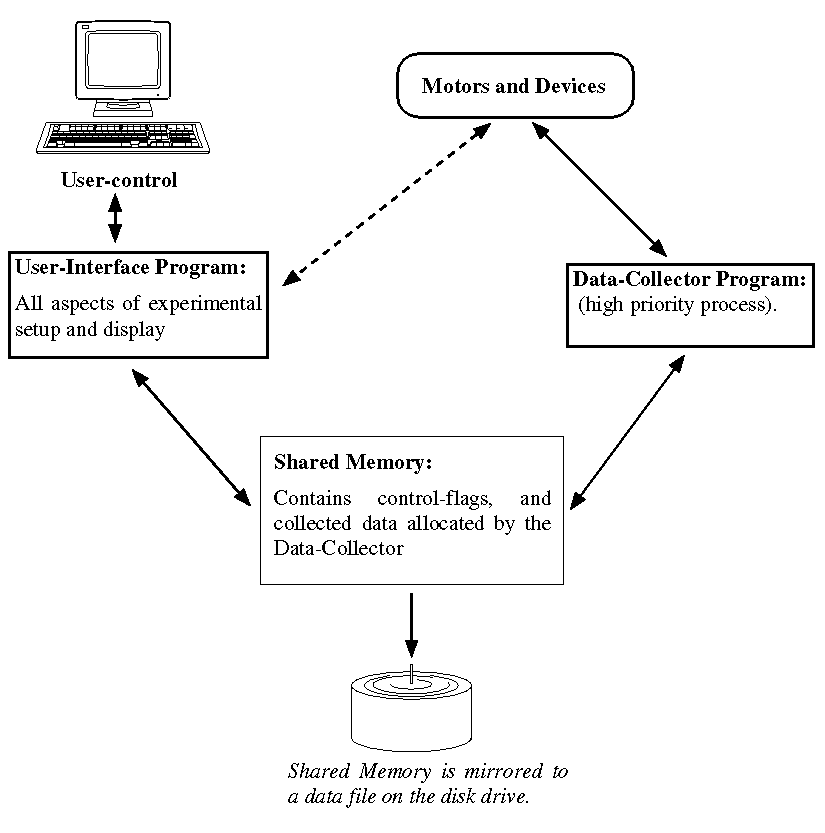
Figure 9. Schematic Program Organization and Control
G.2.
Data File Structure
G.2.1. Data File Header Information
Data collected by XAS-Collect is written in a binary format.
However, all data files contain an ASCII (human readable) header. The Data
File Header contains the following information:
1. The data file title, specifying XAS-Collect version information.
2. The time and date when the data file was written.
3. A summary of data points and columns collected.
4. The name of the detector file used to collect the data set.
5. The name of the region file used to collect the data set.
6. A summary of the monochromator parameters.
7. A summary of the low-signal information.
8. User-entered comments.
It is possible to read the above information directly, simply by "typing"
a given data file. However, the utility XAS_LIST is provided on beam-line
machines specifically to display the above information. For more information
on using this utility see section , p..
G.2.2. Computer Program Functions to Read Both
Binary and ASCII Data Files
'C' language routines to read both the XAS-Collect binary and
ASCII data files are available from Martin George (see p.1 for E-mail,
address etc.).
G.2.3. Conversion From Binary to ASCII Formats
A utility XAS_ASCII is provided on beam-line computers to convert
binary data files to a more portable ASCII format. For more information
on using this utility please see section , p..
G.3. Files and Directories
Used by XAS-Collect
During the process of experimental set-up and data acquisition,
XAS-Collect creates and uses a number of files and directories in a user's
computer account. Efforts have been made to keep these files to a minimum,
both in term of number and size. The following is a summary of these files
and directories:
G.3.1. Files Created by XAS-Collect in the Login
Directory
1. XAS.DIM - This file contains window position and
size information. It enables users to customize their XAS-Collect window
positions and some window sizes.
2. MOTORS.MOT - This contains definitions for the motors used
by XAS-Collect.
3. EX2_COL.DEF - This file contains directory information for
the files used by XAS-Collect as described below.
G.3.2. Directories Used by XAS-Collect
The following directories are used by XAS-Collect; these directories
can be specified by the user and will be automatically created by XAS-Collect
(see , p.).
1. Data Directory.
Data files collected are placed in this directory. By default XAS-Collect
will use the directory $DATA1:[B_USERNAME]. Data filenames are
of the form MYNAME_NNN.MMM, where NNN is the run number
and MMM is the sweep number.
As data is collected, it is initially stored in the file XAS_COLLECTION.DATA.
As each sweep completes, data is written to the final data file. If data
collection is unexpectedly interrupted, the data from any incomplete sweeps
is copied into the file XAS_SAVED_DATA.DATA at the start of the
next data collection sweep. These files are never overwritten; subsequent
copies of these files are simply saved with higher version numbers.
2. Regions Directory.
This directory contains the Regions files used during data collection;
for a full description of Region files see section , p.. By default XAS-Collect
will use the directory name $USER1:[B_USERNAME.REGIONS]. Regions
files have the extension .RGN.
3. Scalers Directory. This directory
contains the Scaler (Detector) files used during data collection; for a
full description of Detector files see section , p.. By default XAS-Collect
will use the directory name $USER1:[B_USERNAME.SCALERS]. Detector
files have the extension .DET.
4. Hardcopy Directory. When
printing, XAS-Collect gives the option of outputting directly to a printer
queue, to a file or to both. This directory is used to contain any such
print files. By default XAS-Collect will use the directory name $USER1:[B_USERNAME.HARDCOPY].
When printing to a print queue, XAS-Collect actually prints to the temporary
file TEST1_TMP.PS, which is deleted as the print operation completes.
5. Scaler Masters Directory.
When a user creates a new scaler (detector) file (see , p.) XAS-Collect
copies a selected master file from this directory into the users own scaler
(detector) file directory. Although users are free to specify a different
Scaler Master Directory, this is not recommended. Scaler masters have extension
.DET. By default XAS-Collect will use the directory name SSRL$LOCAL:[XAS.SCALER_MASTERS].
6. Standard Plots Directory.
This directory contains the standard plot files used in plotting by XAS-Collect.
For a full description see section , p.. By default XAS-Collect will use
the directory name $USER1:[B_USERNAME.PLOT_STD]. Standard plot
files have the extension .PDF.
7. Session Log Directory. XAS-Collect
has the ability to create log files which summarize data collection runs.
These files, with the extension .LOG, are stored in this directory.
By default XAS-Collect will use the directory name $USER1:[B_USERNAME.SESSION_LOG].
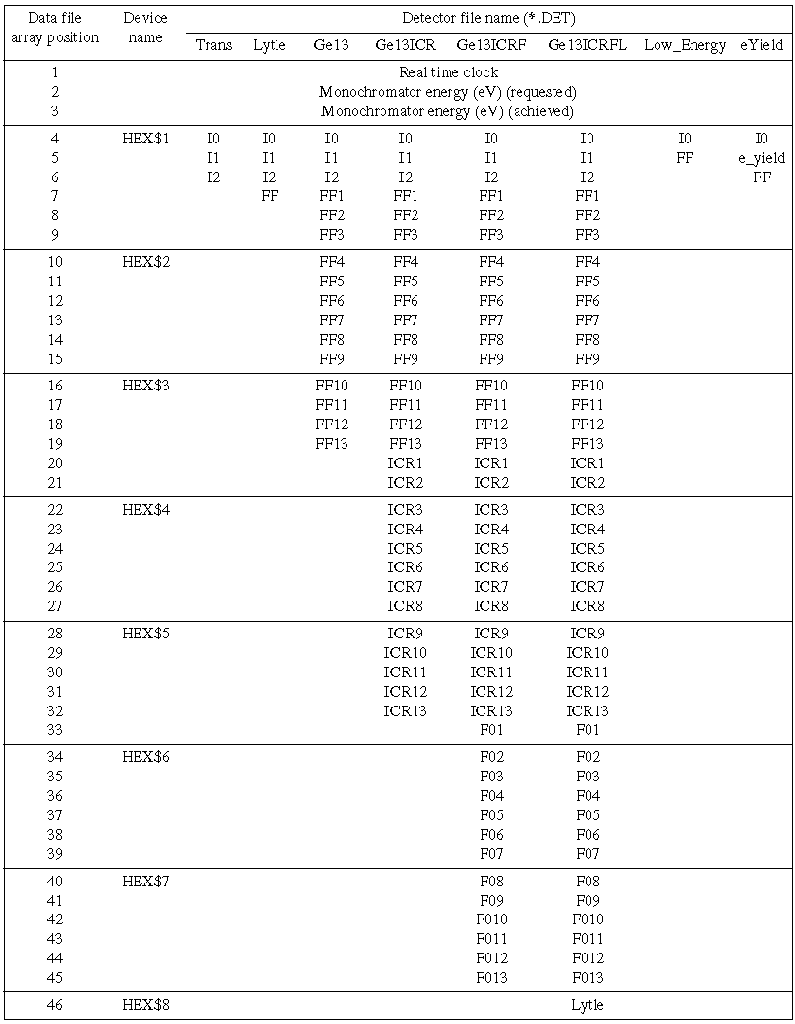
G.4. Detector File
Masters
The following table lists the contents of the master detector
files available when using the option (see , p.).
Table I. Detector File Masters
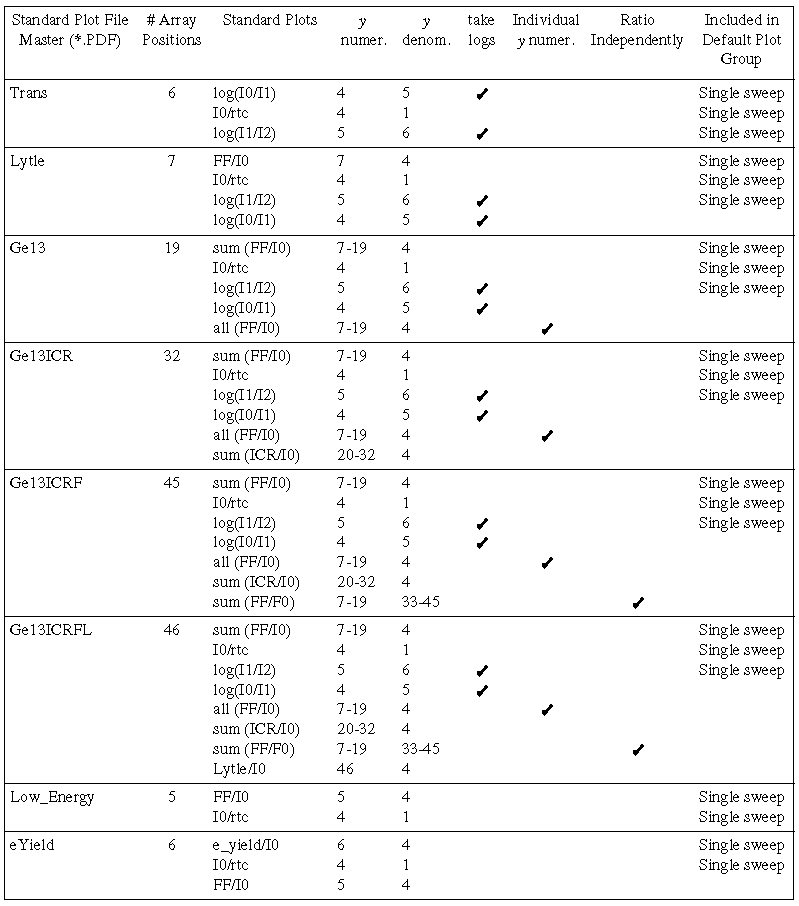
The following table lists the contents of the
master standard plot files. When a new detector file is created using option
(see , p.), the matching master standard plot file (same filename, with
.PDF) is also copied over to the local standard plot file directory (unless
a file of that name already exists, in which case it will not be overwritten).
The plots appearing in the default plot group are indicated in the last
column of the table.
Table II. Default Standard Plot Files
H.
XAS-Collect Utilities
H.1.
XAS
XAS-Collect is usually started by typing XAS at
the prompt. Optional flags may also be used, as follows:
XAS -r Reset: Resets all windows to their original positions
XAS -n New: Starts a new session (no files read in by default)
XAS -h Help: Prints help message
H.2. XAS_ASCII
XAS_ASCII converts XAS-Collect binary data files to an ASCII
file. Type XAS_ASCII at the prompt. At enter file specification:
type either a specific filename, such as $DATA1:[B_USERNAME]THISFILE_032.001,
or a wildcard specification, such as $DATA1:[B_USERNAME]*.0%%.
The option is also given to convert (A)ll, (S)elect or (E)xit.
The chosen files are converted to ASCII with _A appended to the
filename, e.g. THISFILE_032.001 converts to THISFILE_032_A.001.
H.3. XAS_LIST
XAS_LIST lists a summary of data file headers, including
by default the full file name, the number of points and numbers of array
positions, and the first line of comments. Type XAS_LIST at the
prompt. The user is prompted for a file specification (see above). Optional
flags include:
XAS_LIST -r Region: Additionally lists the region filename
XAS_LIST -d Detector: Additionally lists the detector filename
XAS_LIST -c = n Comments: Lists n comment lines (n=1-5).
XAS_LIST -m Monochromator: Additionally lists monochromator
parameters
XAS_LIST -h Help: Prints help message
I.
Basic Guide to Beamline Computers
This section outlines briefly the use of beamline computers.
For more information, refer to Computer Network Group General Info
(by Ellie Fazli) and SSRL Beamline Computer Systems Guide.
I.1. Beamline workstations
Starting a session on the workstation: To start the session,
a username and password is required (if these are not known, contact another
member of your user group). When the workstation is in its "waiting
for login" state, a box labeled "Start Session" is in the
center of the screen, with spaces for Username and Password. Type in the
username and password (the password will not appear) and either hit "Return"
or click on the "Ok" button using the left mouse button. Note
that it may take more than a minute to start the session.
Starting up a DECterm: On starting a session, a DECterm may be launched
automatically (this can take several seconds). The DECterm icon is labeled
with a picture of a terminal. If a new DECterm is needed, then do the following.
Select the Session Manager window, either by clicking once (left mouse
button) in that window if it is already up, or double-clicking on the icon
(labeled with a key). With the left mouse button, click on Applications,
drag to DECterm and release. A new DECterm window will appear after a few
seconds. Click in that window to bring it to the front.
Logging in to SSRL01. Each usergroup is automatically assigned an account
on SSRL01, the general purpose VMS computer system at SSRL. To log in to
SSRL01 from the workstation, type SET HOST SSRL01 at the prompt
in a DECterm window. A Username: prompt will appear. Enter your
username and password for SSRL01.
I.2. Disk quotas and
disk space
On beamline computers, the disk is partitioned into two volumes,
$USER1 and $DATA1. User accounts have a small permanent quota on $USER1,
on which should be kept files required to run XAS-Collect, e.g.
region and detector files. The command SHOW QUOTA displays the
numbers of free blocks. If very few blocks (e.g. <50) are free,
errors may occur on writing files; some files from $USER1 must be deleted,
taking care not to delete vital files. Use PURGE to get rid of
any old versions of files. Log files in the login directory usually are
not needed; use DEL SYS$LOGIN:*.LOG;*. Also, check the hard copy
directory for unneeded files. If disk space is still a problem, contact
a member of the computer group.
On $DATA1 of a beamline machine, no quotas are enabled and the user on
line can use up to the capacity of the disk. Note that it is the user's
responsibility to ensure that proper backups have been made and that, after
a user goes off line, files are subject to deletion without notice. Use
SHOW DEVICE $DATA1 to show the space remaining. It is recommended
that users check the disk periodically, and contact a member of the computer
group if it is close to full. If the disk fills up out of normal working
hours, then back up data files to SSRL and then delete those files (Care!)
from $DATA1.
On SSRL, a user account has a small permanent quota. Temporary extra space,
subject to deletion without notice after 30 days, is available on the disks
$TEMP1 or $TEMP2. Use SHOW QUOTA and SHOW DEVICE $TEMP1
to show space available.
I.3. Backing up to
SSRL
The $TEMP1 and $TEMP2 disks on SSRL are convenient for making
copies of the data files temporarily (see above). On SSRL type:
CREATE/DIR $TEMP1:[B_NAME] To initially create space for B_NAME
account
CREATE/DIR $TEMP1:[B_NAME.JAN96A] Creates a working archive directory
for data
Then, on the beamline machine when it is time to archive:
SET DEF $DATA1:[B_NAME.JAN96] In this example [.JAN96] is the
data directory
COP/LOG *.* SSRL01"B_NAME password"::$TEMP1:[B_NAME.JAN96A]*.*
Copy the files
The following, appended after /log, are useful qualifiers: /before=date
/since=date
I.4. Backing up to
tape
Some beamline computers are equipped with tape drives and
tapes are available through the 120 stockroom. Please refer to the SSRL
Beamline Computer Systems Guide for detailed information regarding
BACKUP.
To load the tape, first slide the write-protect switch on the tape to orange
(for write-protect) or blank (for write-enabled). Wait for a green light
on the drive and raise the flap (to perpendicular), insert the tape and
close the flap. Wait for the green light, then press the red button in.
When the green light comes on again, the tape is loaded. Proceed with commands
as shown below. To unload, after typing the DISMOUNT command, push the
red button on the drive, wait until the green light is on steadily, then
open the flap and remove the tape. The following are valid backup commands:
|
Command |
Action |
| initialize $tape1: mytape | initializes new tape (NOTE: will erase any previous data), labels it "mytape" |
| mount/foreign $tape1: | mounts tape, makes it available for backup |
| backup/log $data1:[b_user.j96]*.*;* $tape1:j96a.bck/save/label=mytape | backs up all files from $data1:[b_user.j96] to a saveset called "j96a.bck" on the tape labeled "mytape" |
| backup/log $tape1:j96a.bck/save/select=*.*;* $data1:[b_user.new]*.*;* | extracts all files from the tape saveset "j96a.bck" and puts them into $data1:[b_user.new] |
| backup/list $tape1:*.* | lists contents of all savesets on a tape |
| set mag/rewind $tape1: | rewinds tape to the beginning |
| set mag/skip=end $tape1: | winds tape to the end of data |
| dismount $tape1: | dismounts the tape |
I.5.
Useful SSRL utilities
Electronic Mail. To send and receive electronic
mail, type MAIL at the $ prompt. To send mail to a remote
site, e.g. to my_prof@his.home.edu, at the MAIL> prompt enter
SEND, then at To: enter MX%"my_prof@his.home.edu".
For more information, refer to SSRL Guide to VAX MAIL.
Spear Talk. Information on status of SPEAR and SSRL beamlines, both current
and archived. Type STALK at the $ prompt.
Staff and User Database. For information on a user, type FIND
and the name, e.g. FIND PRINCE. For information on a staffperson,
type TEL and the name, e.g. TEL PICKERING.
Liquid helium ordering. Type LHE at the $ prompt.
Stockroom database. Displays the availability and price of items in the
120 stockroom. Type STOCK then the item name or part of name.
e.g. STOCK BEAKER or STOCK TAPE.
SSRL bulletin board. Type BULLETIN at the $ prompt.