In optics, the term "dichroism" refers to changes in the absorption
of polarized light on passing through a material in two different directions.
Since materials typically absorb one color of white light preferentially,
the material appears with two different colors for the two light directions
- it is di- (two-) c
hroic (colored). Today, the term dichroism is used more
generally to reflect the dependence of photon absorption of a material on polarization.
The origin of the dichroism effect can be anisotropies in the charge or the
spin in the material. In the latter case we speak of magnetic dichroism. Here
we briefly discuss the principles and applications of magnetic dichroism techniques
in the x-ray region, the X-Ray Magnetic Circular Dichroism (XMCD) and X-Ray
Magnetic Linear Dichroism (XML
D) techniques.
X-ray absorption spectroscopy (XAS) utilizes the energy dependent absorption
of x-rays to obtain information about the elemental composition of the sample,
as illustrated in Fig. 1.

Fig. 1: X-ray absorption spectra of a wedge sample, revealing the composition at various points along the wedge. Note that the Fe signal increases from bottom to top because of the increasing Fe layer thickness and the Ni signal decreases because of the limited electron escape depth of the total electron yield signal used to record the spectra. The Cu signal is constant, reflecting its constant 1nm thickness.
It also gives information on the chemical environment of the atoms (also see NEXAFS Spectroscopy) and their magnetic state. Core electrons are excited in the absorption process into empty states above the Fermi energy and thereby probe the electronic and magnetic properties of the empty valence levels. In the following we are concerned with the spectra of the magnetic 3d transition metal elements Fe, Co and Ni. Their magnetic properties are largely determined by the 3d valence electrons. Since x-ray absorption spectra are governed by dipole selection rules the d-shell properties are best probed by L-edge absorption studies (2p to 3d transitions). The L-edge x-ray absorption spectra of the transiti on metals and oxides are dominated by two main peaks separated by about 15 eV as shown in Fig. 2.

Fig. 2: L-edge x-ray absorption edge spectra of Fe, Co and Ni in the form of the elemental metals and as oxides. They two main structures are called the L3 (lower energy) and L2 absorption edges.
The two main peaks in the spectra arise from the spin orbit intera ction of the 2p core shell and the total intensity of the peaks is proportional to the number of empty 3d valence states. The metal spectra mainly show two broad peaks, reflecting the width of the empty d-bands. The oxide spectra exhibit considerable fine structure, called multiplet structure. The empty oxide states are more localized than metal states and their energies are determined by crystal field and multiplet effects. Multiplet effects arise from the spin and orbital momentum coupling of different 3d valence holes (or electrons) in the electronic ground state, and from coupled states formed after x-ray absorption between the 3d valence holes and the 2p core hole (see Fig. 5 below for the case of NiO).
The metals are usually ferromagnetic and their magnetic properties are best studied with X-Ray Magnetic Circular Dichroism (XMCD) spectroscopy, while the oxides are usually antiferromagnetic and are studied with X-Ray Magnetic Linear Dichroism (XMLD ) spectroscopy. Both XMCD and XMLD effects are large as illustrated in Fig. 3, and in the following we shall discuss the two techniques in detail.
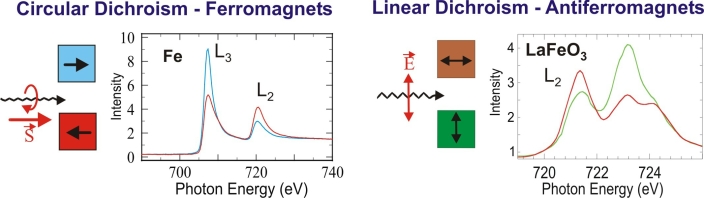
Fig. 3: Illustration of the size of magnetic dichroism effects. Note that the XMLD effect is large only in cases where the absorption edge exhibits multiplet structure.
The concepts of XMCD spectroscopy, pioneered by Gisela Schütz et al. in 1987, are illustrated in Fig. 4. The first x-ray absorption sum rule links the total intensity of the L3 and L2 resonances with the number N of empty d states (holes). The d valence shell can hold up to 10 electrons which are filled into band states up to the Fermi level and the number of filled states is therefore 10 -N. For a magnetic material the d shell has a spin moment which is given by the imbalance of spin-up and spin-down electrons or equivalentl y (except for the sign) by the imbalance of spin-up and spin-down holes. In order to measure the difference in the number of d holes with up and down spin, we need to make the x-ray absorption process spin dependent. This is done by use of right or left circularly polarized photons which transfer their angular momentum to the excited photoelectron.
The photoelectron carries the transferred angular momentum as a spin or an angular momentum, or both (Stohr & Wu). If the photoelectron originates from a spin-orbit split level, e.g. the p3/2 level (L3 edge), the angular momentum of the photon can be transferred in part to the spin through the spin-orbit coupling. Right circular photons (RCP) transfer the opposite momentum to the electron as left circular photons (LCP) photons, and hence photoelectrons with opposite spins are created in the two cases. Since the p3/2 (L3) and p1/2 (L2) levels have opposite spin-orbit coupling, the spin polarization will be opposite at the two edges. In the absorption process, "spin-up" and "spin-down" are defined relative to the photon helicity or photon spin.

Fig. 4: Electronic transitions in conventional L-edge x-ray absorption (a),
and x-ray magnetic circular x-ray dichroism (b,c), illustrated in a one-electron
model. The transitions occur from the spin-orbit split 2p core shell to empty
conduction band states. In conventional x-ray absorption the total transition
intensity of the two peaks is proportional to the number of d holes (first sum
rule). By use of circularly polarized x-rays the spin moment (b) and orbital
moment (c) can be determined from linear combinations of the dichroic difference
intensities A and B, according to other sum rules.
Since spin flips are forbidd
en in electric dipole transitions, spin-up (spin-down)
photoelectrons from the p core shell can only be excited into spin-up (spin-down)
d hole states. Hence the spin-split valence shell acts as a detector for the
spin of the excited photoelectron and the transition intensity is simply proportional
to the number of empty d states of a given spin. The quantization axis of the
valence shell "detector" is given by the magnetization direction.
The size of the dichroism effect s
cales like cos θ, where θ is the angle between
the photon spin and the magnetization direction. Hence the maximum dichroism
effect (typically 20%) is observed if the photon spin direction and the magnetization
directions are parallel and anti-parallel as shown on the left side of Fig.
3. When the photon spin and the magnetization directions are perpendicular the
resonance intensities at the L3 and L2 edges lie between those obtained for
parallel and
anti-parallel alignments.
The L3 and L2 resonance intensities and their differences for parallel and anti-parallel orientation of photon spin and magnetization directions are quantitatively related by sum rules to the number of d holes and the size of the spin and orbital magnetic moments. Angle dependent measurements in external magnetic fields give the anisotropies of the spin density and orbital moment. For a review see IBM. J . Res. Develop. 42, 73 (1998) and J. Magn. Magn. Mater. 200, 470 (1999).
XMLD spectroscopy was pioneered by Gerrit van der Laan et al. in 1986. The electric field vector E of linearly polarized x-rays acts as a search light for the number of valence holes in different directions of the atomic volume. In most cases the anisotropy of the charge in the atomic volume is caused by an anisotropy in the bonding, i.e. by the electrostatic potential. In the absence of spin order, linear dichroism NEXAFS spectroscopy can only determine charge order in systems where the absorbing atom has lower than cubic symmetry. However, in the presence of spin order the spin-orbit coupling leads to preferential charge order relative to the spin direction even in cubic systems. This effect is the basis for the determination of the spin axis in ferromagnetic and especially antiferromagnetic systems by means of x-ray magn etic linear dichroism (XMLD) spectroscopy. Since the electric field vector oscillates in time along an axis and the radiation may be absorbed at any time, linearly polarized x-rays are only sensitive to axial not directional properties. Hence one can determine the orientation of the antiferromagnetic or ferromagnetic axis, but the spin direction itself cannot be determined.
Fig. 5 illustrates the origin of the XMLD effect in NiO. Because of the cubic symmetry of the NiO latt ice the charge distribution around the atoms is nearly spherical and no linear dichroism effect exists above the Néel temperature (520 K), where NiO is paramagnetic. At room temperature, NiO is antiferromagnetic and the Ni spins are oriented in the (1,1,1) plane along three possible directions in the fcc lattice. There is no net magnetic moment because an equal number of spins point into opposite directions, so only a preferential magnetic axis exists. The alignment of the loc al atomic spins along this axis breaks the cubic symmetry of the charge through the spin orbit coupling. As a consequence the charge exhibits a small anisotropy in the unit cell, i.e. it is no longer spherical but shows an ellipse-like distortion about the magnetic direction. This charge anisotropy leads to an asymmetry of the x-ray absorption signal through the search light effect.
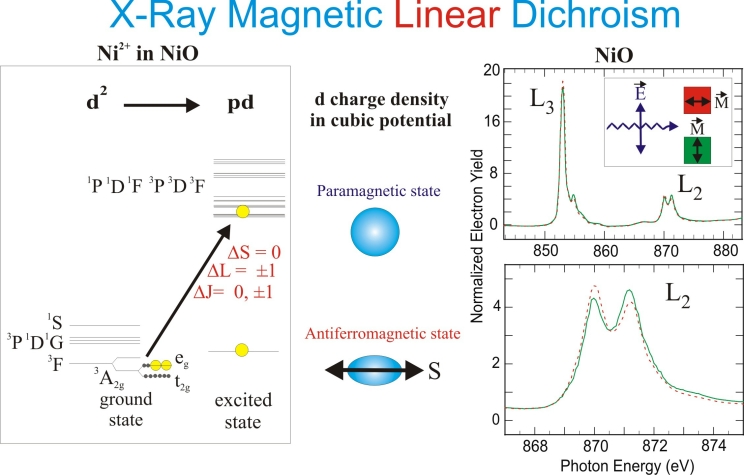
Fig. 5: Origin of XMLD for NiO. On the left we show the electronic configurations involved in the x-ray absorption process. In the ground state there are two d holes (d2 hole configuration) and their energy levels are determined by multiplet and crystal field effects. In the final state, a 2p hole is created by x-ray absorption and one d hole is filled by the excited electron. The resulting pd hole configuration again gives rise to multiplet splitting and the XAS spectr um reflects the multiplet structure. In the paramagnetic state the absorption spectrum of NiO does not exhibit a polarization dependence because of cubic symmetry. In the antiferromagnetic state the spin-orbit coupling leads to a distortion of the charge density and an XMLD effect is observed.
The maximum XMLD difference is obtained for E parallel versus E perpendicular to the magnetic axis, as shown in Fig. 5. In contrast to the XMCD effect the XMLD effect has a cos 2θ dependence, where θ is the angle between E and the magnetic axis. In general, the XMLD effect is small in 3d metals owing to the small size of the spin orbit interaction and the large band width, resulting in a small charge anisotropy when the d states are summed over the Brillouin zone. However, a sizeable XMLD effect (of order 10-30%) may be observed in the presence of multiplet splitting. At a particular multiplet energy only selected d valence states are prob ed through matrix element effects that enhance the XMLD effect. In a simple picture we can view each multiplet as a strongly coupled spin-orbit state whose spatial extent is non-spherical, giving rise to the large XMLD effect. In Fig. 5 the XMLD effect is especially visible at the Ni L2-edge where a sizeable difference is observed for E parallel (green) versus perpendicular (red) to the magnetic axis. Since x-ray linear dichroism can arise from electric and magnetic asymmetrie s, care needs to be taken to distinguish magnetic order effects from ligand field effects. This is typically done through temperature dependent measurements.
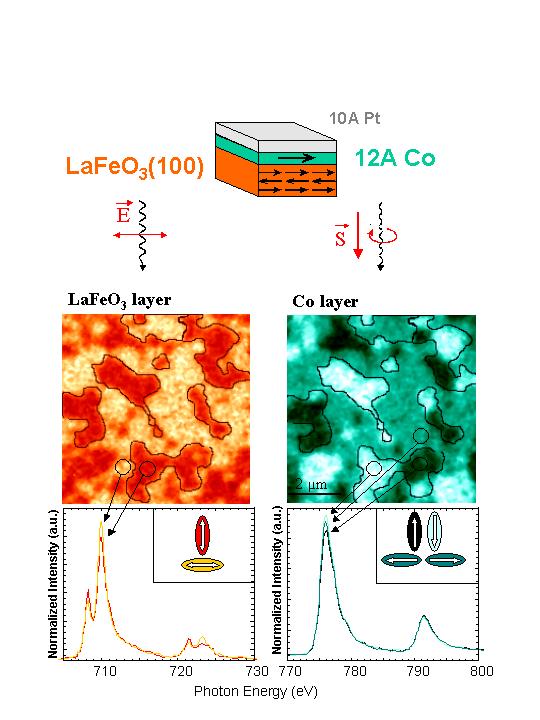
Since handed circularly polarized x-rays have directionality they can detect the direction of the spin and orbital moments, a fact utilized in XMCD microscopy of ferromagnets. Similarly, the dependence of the XMLD intensity on the relative orientation of the electric field vector and the magnetic axis can be used for XML D imaging and proves especially useful for antiferromagnets. Such systems cannot be studied by many techniques because of their compensated spin structure. Fig. 6 shows how XMLD and XMCD imaging is done by means of photoemission electron microscopy, PEEM.

Fig. 6: Magnetic imaging by means of PEEM. A layer in the sample is selected by tuning the x-ray energy to the desired element. X-ray polarization contrast at an absorption peak is used for imaging contrast. The local electron yield from a sample region, imaged by PEEM, depends on the relative orientation of the magnetic direction or axis and the polarization, as illustrated on the right.
Let us assume that we have a sandwich sample consisting of a ferromagnet and an antiferromagnet. First, we tune the photon energy to an element in the antiferromagnet, say Fe in LaFeO3, as shown in Fig. 6. We then change the x-ray polarization to linear and fine-tune the x-ray energy to 721 eV where a large XMLD effect exists, as shown in Figs. 3 or 6. When we image the electron intensity with PEEM at this energy, domains with their axis perpendicular to the E vector will give a higher electron yield than those with their axis parallel to the E vector. In order to enhance the contrast we take a second image at 723eV, where the contrast is inve rted and divide the two images. This gives us the antiferromagnetic domain structure.
We now tune the energy to the ferromagnetic element, say Co, and change the polarization to left circular. We fine-tune to the Co L3 energy, 778eV, and take an image. Domains with their magnetization direction pointing into the photon propagation direction will give the largest electron intensity, as illustrated in Fig. 6 bottom right. We then change the polarization to right circula r and take another picture with opposite contrast. Division of the two images gives us the ferromagnetic domain structure.
A nice example of PEEM microscopy is given in Fig. 7. The picture is a color version of one published in Nature 405, 767 (2000). It shows the coupling of the spins, domain by domain, in the antiferromagnetic LaFeO3 film with those in a thin Co layer on top. The spectra below the images are taken in the identi fied regions of the images. The intensity difference at the resonance positions gives rise to the contrast in the images.
Finally, we show how one can choose a special geometry to image all four ferromagnetic domains in a situation like that encountered for Co/LaFeO3(100) of Fig. 7. The same four domain geometry is also encountered for Co/NiO(100), and in Fig. 8 we show results for the Co domain pattern on NiO(100). By rotating the sample so that one magnetization direction makes the "magic projection angle" of 18.4o with the x-ray propagation direction (red wiggly arrow), one can distinguish all four domains as shown on the left. At this angle the contrast reflects equal XMCD intensity differences as shown on the right for the Co L3 peak. The spectra were recorded for the regions marked with green, black, red and blue dots in the image. In our case the XMCD effect gives rise to a 6% change from curve to curve with a total effect of about 18% between the green and blue curves.

Fig. 8: Ferromagnetic domain pattern for a thin Co layer on NiO(100), showing
all four spin directions in Co. The spin directions are pinned by the underlying
NiO.