|
The first crystal structures of DNA double helices appeared in 1979 and
directly confirmed the atomic model of Watson-Crick from 25 years earlier.
Since then, DNA has been modeled as a relatively rigid polymer. An isotropic
elastic rod model of the polymer has proven to be exceptionally good at
integrating classical biochemical measurements on DNA with recent
single-molecule results for DNA on length scales of 100 nm or longer.
Nevertheless, unusual mechanical properties have been reported recently with
regard to twist-stretch coupling [1] and bending rigidity
[2-3]. Still missing,
however, has been a direct measurement of DNA structural fluctuations on short
length scales in the absence of external force.
In principle, molecular rulers should be ideal tools for characterizing DNA
structural fluctuations. Spectroscopic molecular rulers are frequently used to
measure distances in solution. Existing techniques suffer from two limitations:
they do not provide quantitatively accurate distance values and they cannot
accurately determine distributions composed of multiple different distances. An
alternative physical phenomenon on which to base a molecular ruler is X-ray
scattering interference. Solution X-ray scattering techniques are primarily
used to obtain the average compactness of macromolecules. To allow for
site-specific measurements, one could incorporate strongly-scattering probes
into a structure and detect the scattering interference between them. Fourier
transformation of this interference signal would directly yield the
distribution of interprobe distances.
In this work, we have developed a molecular ruler that utilizes 14-Å gold
nanocrystal probes attached site-specifically to DNA duplexes. The experiments
were carried out at beamline 4-2 of the Stanford Synchrotron Radiation Lab
(SSRL). We measured the pattern of X-ray scattering interference between the
nanocrystals and transformed it into the point-to-point distance probability
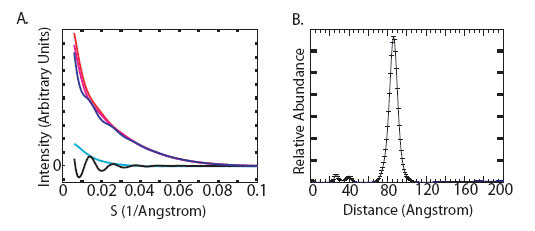
distribution between their centers-of-mass (Figure 1). To determine the
scattering interference pattern between two gold nanocrystals attached to a DNA
duplex, five different scattering profiles were collected. Profiles for the
gold nanocrystals alone, DNA alone, two single-labeled DNA duplexes and a
double-labeled DNA duplex were acquired and scaled relative to each other, then
summed to generate a nanocrystal interference pattern (Figure 1A). These
patterns were transformed into inter-nanocrystal center-of-mass distance
distributions using a non-negative least squares algorithm (Figure 1B).
|  |
|
Figure 1:
[A] Scattering intensity as a function of scattering angle for the 20 base-pair
double-labeled (blue), single-labeled (red, magenta; indistinguishable), and
unlabeled (cyan) DNA duplexes. The intensity of the double-labeled sample has
been scaled by a factor of 1/2 to aid visual comparison. The pattern of
scattering interference between the two nanocrystal labels (black) is obtained
by summing the intensities of the double-labeled and unlabeled samples, then
subtracting the intensities of the two single-labeled samples. [B]
Transformation of the nanocrystal scattering interference pattern into a
weighted sum of sinusoidal basis functions (corresponding to different
interprobe distances) yields the probability distribution for nanocrystal
center-of-mass separation.
|
|
 | |
|
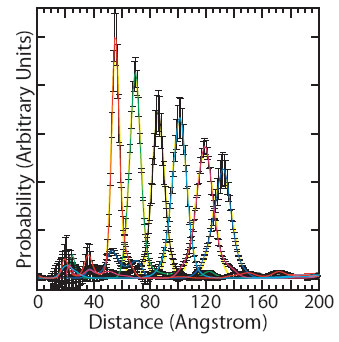
Figure 2:
Probability distance distribution curves for the 10-bp (red), 15-bp (green),
20-bp (black), 25-bp (cyan), 30-bp (magenta), and 35-bp (blue) duplexes. The
distributions were normalized to sum to unity. Each distribution was fit to a
Gaussian curve (yellow).
| |
Scattering interference profiles for DNA duplexes ranging from 10 to 35
base-pairs in length were measured and gave distance distributions with
approximately symmetric fluctuations around a well-defined mean distance
(Figure 2). The interprobe distances were fit to a three variable model of the
DNA helix and indicate a helical rise value of 3.29 � 0.07 Å, in close
agreement with the crystallographic average value of 3.32 � 0.19 Å [4]. Structural fluctuations of the DNA should be reflected in
the width of the measured distance distributions after DNA-independent factors
have been taken into account (Figure 3). The distance distributions are not
consistent with the conventional model of the DNA duplex as an isotropic
elastic rod with a stretch modulus of ~1000 pN. A linear fit of the observed
variances with respect to DNA length indicates an apparent stretch modulus of
~133 pN. The elastic rod model predicts that the variance should increase
linearly with the number of base steps (Figure 3A). In contrast, we observe a
partial quadratic dependence of variance on DNA length. The data fit a partial
quadratic dependence to within the measurement error (black line; X2
= 7.5 with 6 degrees of freedom; P = 0.28), but not a linear dependence (cyan
dashed line; X2 = 41 with 7 degrees of freedom; P = 1.0 x
10-17). A quadratic increase in variance can only occur if the
stretching fluctuations are tightly correlated. Fits to models that interpolate
between linear and quadratic dependences with a range of correlation lengths
demonstrate that the stretching correlation must persist over two turns of the
double helix. The data indicate that short DNA fragments stretch cooperatively.
In light of this surprising observation, we reexamined previous structural
studies of short DNA duplexes. Analysis of the end-to-end lengths for DNA
duplexes in the Nucleic Acid Database revealed a range of distances that is
consistent with our solution observations. However, a plot of crystallographic
length variance with respect to the number of base steps is inconclusive with
respect to the cooperativity of DNA stretching (Figure 3B). Plots of the
end-to-end length variance derived from time-resolved single molecule FRET and
electron spin resonance data with respect to duplex length are better fit by a
quadratic relationship than by a linear relationship (Figure 3C-D). These
independent measurements support the conclusion that short DNA duplexes stretch
cooperatively.
These findings, taken together with other recently discovered nonideal
properties of DNA [1-3], imply that a new
theoretical framework is required to describe the mechanical properties of DNA
on short length scales. The presence of stretching correlations over 20 base
pairs implies that DNA double helices can transmit information through an
allosteric "domino effect". Whether such allosteric communication alters how
the double helix and its specific binding partners interact to regulate
biological processes remains to be seen but is an exciting possibility.
|  |
|
Figure 3:
[A] Variance in nanocrystal-nanocrystal separation distance of
end-labeled
duplexes (circles) and internally labeled duplexes (triangles), plotted with
respect to the number of intervening DNA base-pair steps. The variance
predictions for an ideal elastic rod with a stretching modulus of 1000 pN (the
value measured in single-molecule stretching experiments) are shown (dashed
black line) and deviate grossly from the data. A linear relationship between
variance and base-pair steps (dashed cyan line) is expected if the stretching
of base-pair steps is uncorrelated along the DNA duplex. Alternatively, a
partial quadratic relationship (solid black line) should hold if the DNA
stretches cooperatively with a correlation length of 20 base-pair steps.
[B]
Variance of the inter-strand separation distance between 3'-phosphates as
measured by X-ray crystallography [squares] is plotted as a function of the
number of intervening base-steps. [C] Variance of the inter-strand
separation distance between fluorophores as measured by time-resolved
single-molecule FRET (trsmFRET) experiments [5] [circles] is
plotted as a function of the number of intervening base-steps. [D]
Variance of the inter-strand separation distance between nitroxide labels as
measured by double electron-electron resonance (DEER) experiments
[6] (click here
for higher resolution image)
|
|
Primary Citation:
R.S. Mathew-Fenn, R. Das, J.A. Silverman, P.A. Walker, P.A.B. Harbury, "A
Molecular Ruler for Measuring Quantitative Distance Distributions." PLoS
ONE 3,e3229 (2008).
R.S. Mathew-Fenn, R. Das, P.A.B. Harbury, "Remeasuring the Double Helix."
Science 322, 446 (2008).
References:
-
J. Gore et al., Nature 442, 836 (2006).
-
T.E. Cloutier, J. Widom, Mol. Cell 14, 355 (2004).
-
T.E. Cloutier, J. Widom, Proc. Natl. Acad. Sci. USA
102, 3645 (2005).
-
W.K. Olson, A.A. Gorin, X.J. Lu, L.M. Hock, V.B. Zhurkin, Proc. Natl.
Acad. Sci. USA 95, 11163 (1998).
-
T.A. Laurence, X. Kong, M. Jager, S. Weiss, Proc. Natl. Acad. Sci. USA
102, 17348 (2005).
-
Q. Cai et al., Nucleic Acids Res. 34, 4722 (2006).
|
|
