
To determine the theoretical flux which should be present in one's hutch
on a beam line at SSRL there are a number of calculations which must be
performed. There are several apertures which limit the number of
photons emitted from the source reaching the ion chamber. The most important
and obvious one is the monochromator, which has a band pass which is typically
on the order of 10-4, but is dependent on the energy and which set of crystals
(111, 220 or 400) is used. There are other apertures which must also be
included. In order to make it easier for the user to calculate flux
on the x-ray beam lines the following graphs are presented. The first
is a plot of flux vs. energy for several of the insertion device beam lines
at SSRL and, for comparison, the flux from B.L. 1-5, the original "EXAFS
I". Figure 1 looks different from the standard flux curves presented
in many publications because it has a linear energy scale and is only plotted
over the energy region most often used in experiments on the SSRL x-ray
beam lines. The curves have already been corrected for the absorbers
that are present in the beam lines, such as Be windows, He beampath and
carbon filters before the Be window, although for one curve, B.L. 6-2 at
5KG, the carbon filter has been removed. The curve lists the flux
per mA, per mrad, per second, per 100% bandwidth. Figure 2 is the
more familiar set of curves plotted on log-log scale, although in this
case the curves are plotted from 100 eV out to 50 keV. In Figure
2 no absorption has been included. Again, the abscissa lists flux
per mA, per mrad, per second, per 100% bandwidth. The flux values
for Figures 1 and 2 were determined by calculating the flux for a 10% bandwidth
and then multiplying the result by 10.
Monochromator Band Pass
The flux scale of 100% bandwidth is chosen so that the values from Figure
3, the monochromator crystal band pass, can be directly multiplied by the
flux to get the number of photons that are transmitted by the monochromator.
Figure 3 is a plot of the band pass for Si(111), Si(220) and Si(400) crystal
pairs. These values were obtained by determining the integrated reflectivity
in radians of the crystal pairs for each energy and multiplying by cot(q)
where q is the bragg angle of the crystal at that energy. The integrated
reflectivity was obtained by calculating the shape of the two-crystal rocking
curve width and integrating the reflectivity at each point on the rocking
curve. The result can be thought of as the width of a square 100%
reflectivity Darwin curve. Note that this is not the same as the
energy resolution of the monochromator crystals. That value will
be discussed below.
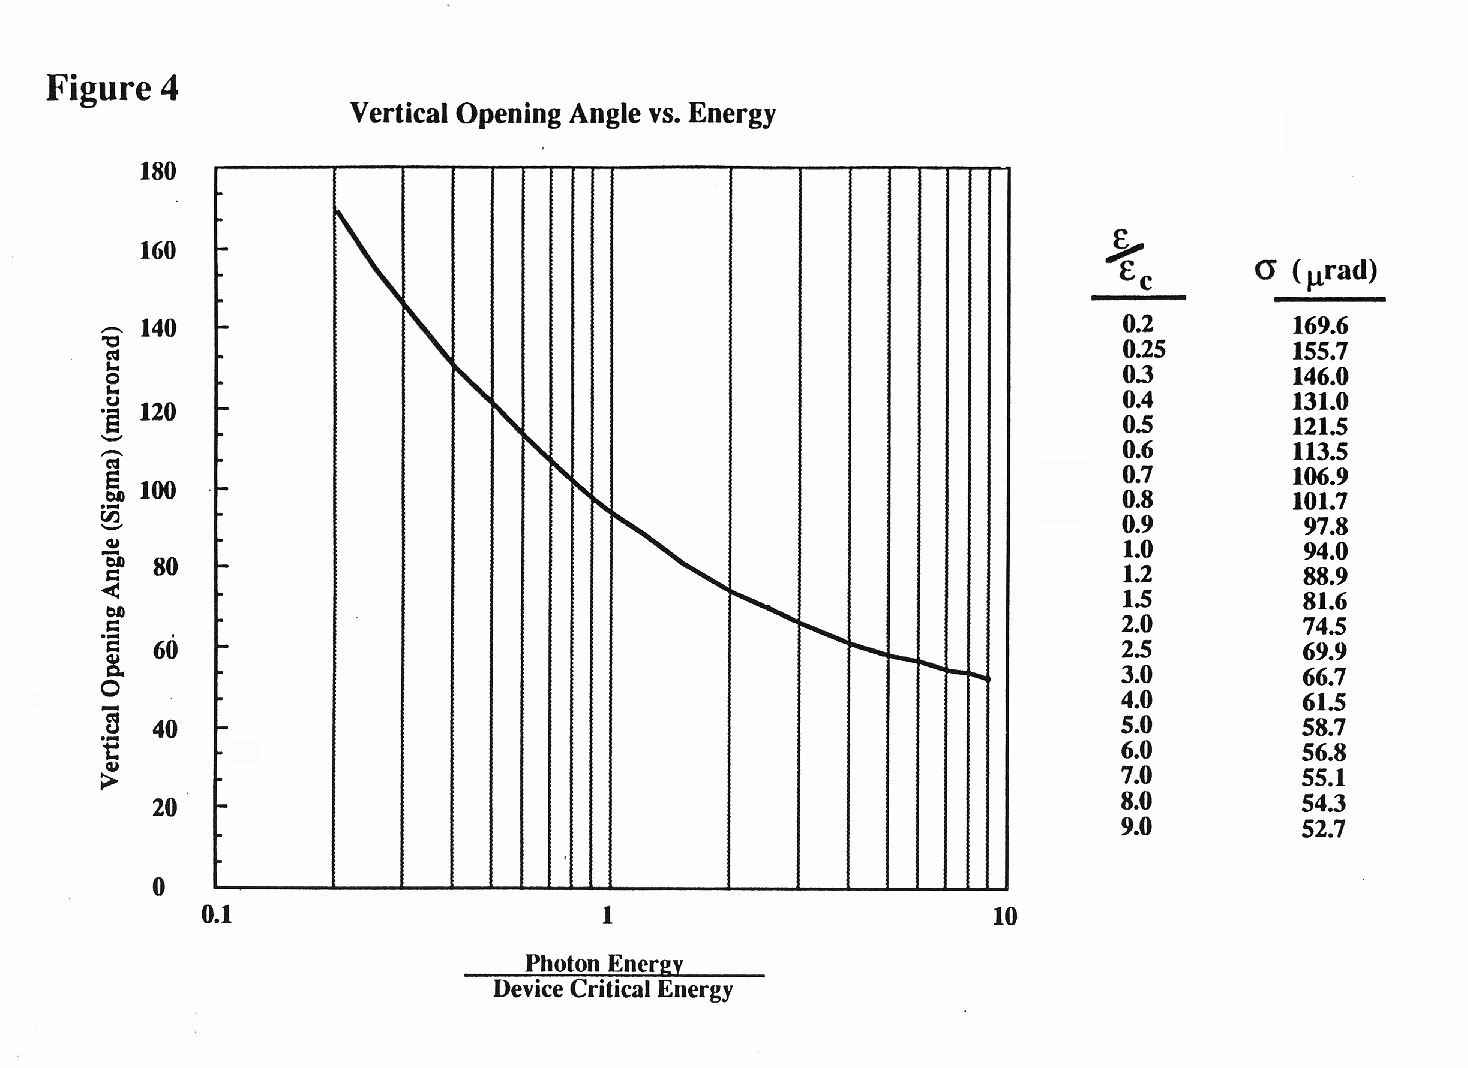
Vertical Opening Angle
The fourth plot is the photon opening angle of an individual electron as a function of the ratio of the photon energy to the device critical energy convolved with the electron beam divergence. The electron beam divergence used in this calculation is 45 mrad, which is the typical value for an insertion device straight section with 2% emittance ratio. Because bend magnets have a different electron beam divergence (70 mrad) this curve is only valid for an insertion device beam line. Since these values are added in quadrature to the photon opening angle only for photon energies well above the device critical angle is the beam divergence a significant factor. The device critical energy is simply related to the device magnetic field and the ring energy,
critical energy [eV] = ec = 66.51 * B[KG] * E2 [GeV] = 598.6*B[KG] 1
The curves plotted in Figures 1 and 2 are for specific wiggler fields, thus for specific critical energies. The critical energies are:
4 / 7 (18KG)
10775 eV
6
(5KG)
2993 eV
6 (8.5KG)
5088 eV
10 (14.5 KG)
8680 eV
Bend Magnet
4715 eV
The ratio of the photon energy to these critical energies must be used to determine the vertical opening angle from Figure 4.
For wiggler side stations there is a slightly different effective critical energy than for the end station beam line. For B.L.s 4-1 and 4-3, which are 6.67 mrad off the center of B.L. 4, the effect is such that the critical energy is 9270 eV, whereas for 7-3, which is 5.6 mrad off the center of B.L. 7 the critical energy is 9700 eV. By comparing the shape of the curves for 10-2 and that for 4 or 7 in Figure 2 one can see that the effect of changing the critical energy from 10775 eV (4) to 8680 eV (10) is only significant at energies above 20 keV. At 20 keV B.L. 4-2 has roughly 25% more flux than B.L. 4-3; at 10 keV the difference is closer to 10%.
Apertures
There are a variety of vertical apertures in the beam lines which limit
the amount of radiation which gets to the hutch. The simplest approach
to determine the effect of an aperture is to compare the s opening angle
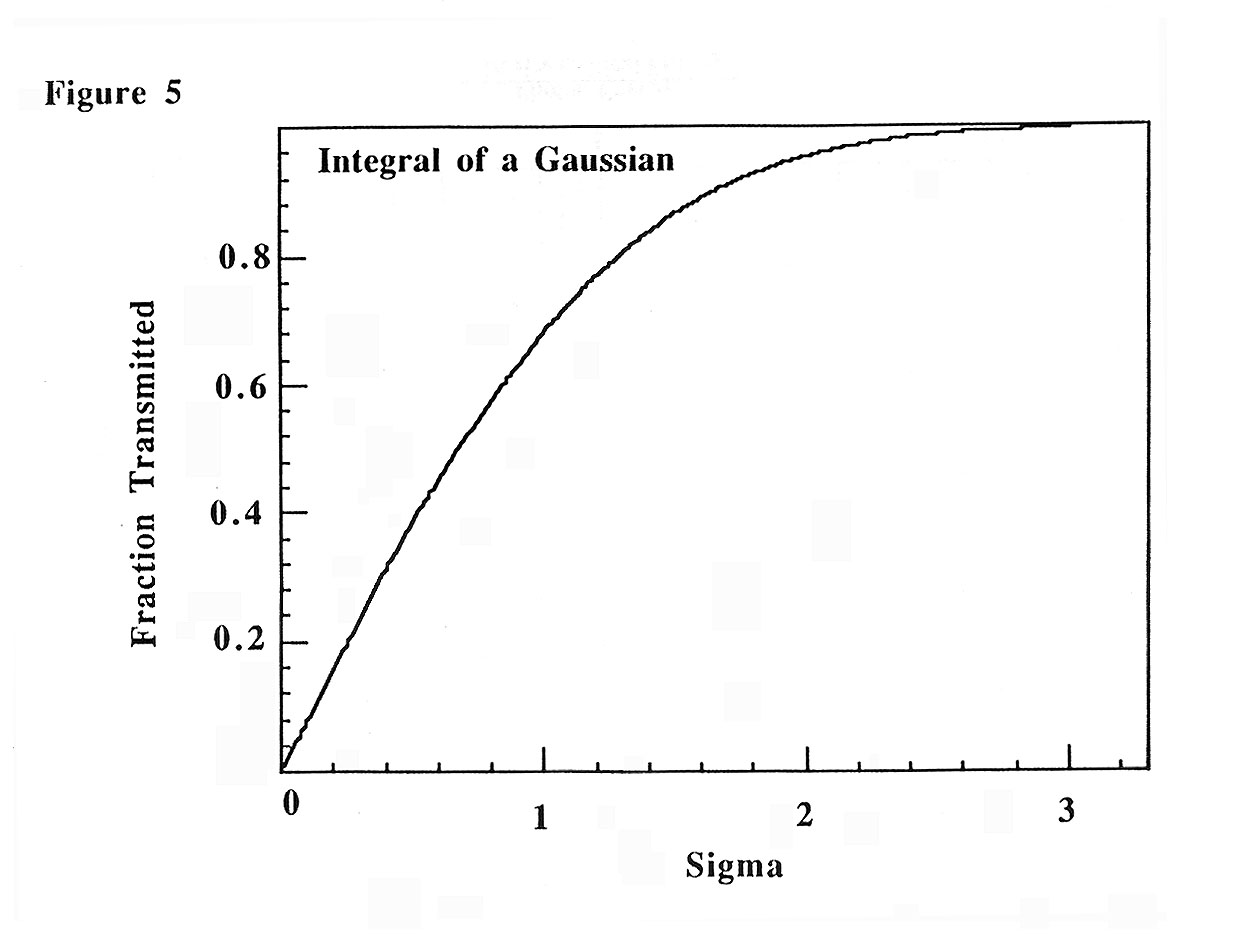
of the beam (Figure 4) with the 1/2 width of the aperture. Using
Figure 5, the integral of a Gaussian, the fraction of the radiation which
is transmitted can be determined. For instance, B.L. 7-2 is often
run at 8050 eV with a 129 mrad (FWHM) slit in front of the mirror.
To calculate the amount of radiation that slit passes, divide the slit
width by 2, then take the ratio of that value to the opening angle for
the energy of interest. On 7-2 at 8050 eV the opening angle is roughly
104 mrad. The slit therefore passes 0.62 s of the radiation, which
means that 42% of the beam is passed.
For B.L.s 4 and 7 the Be window aperture is 10 mm tall, and does not act as a significant aperture. There are slits upstream of the mirror which are often used to limit the vertical divergence. Three vertically defining slits are possible, 64.5 mrad, 129 mrad and 252 mrad (FWHM). There are also slits prior to the monochromator which are fully adjustable. They are 23.5 m from the source for 4-2, 23 m from the source on 7-2, 18 m from the source on 7-3, 16.7 m from the source on 4-3 and 18.7 m from the source on 4-1.
B.L.s 6 and 10 have 3 mm tall Be window apertures at a distance of 17.8
m from the source. This translates into a 168 mrad (FWHM) slit in
unfocused mode. They also have fully adjustable slits at 11.5 m from
the source, but no other slits before the monochromator. By determining
which is the limiting aperture in the system the percentage of the vertical
swath of radiation which is transmitted by that aperture can be found.
Energy Resolution
A second benefit of determining the limiting aperture of the beam line is that it also defines the energy resolution of the monochromator crystals, using the relationship
DE/E = cot(q) dq, 2
where q is the bragg angle of the monochromator and the dq is the vertical band pass of the narrowest aperture in the beam line. The reason why the vertical divergence of the beam and not the integrated reflectivity is used to determine the energy resolution is that the source is polychromatic, thus at any angle of incidence on the first crystal there photons with a wavelength which matches the bragg angle.
Things become somewhat more complicated for focused radiation. The mirrors all have an effective vertical acceptance which must be considered. Because the cross-section of the mirror is a smile rather than a square aperture to truly determine the acceptance of a mirror requires a ray-tracing program. The values given here will therefore be more of an approximation than the values given for unfocused radiation. There is also an effect on the effective vertical aperture if it is downstream from the mirror. Because the focusing systems on these beam lines are close to 1-1 one can use the simple expedient of determining the distance from the slit which is downstream of the mirror to the focal point at the hutch. That is the effective distance from the slit to be used to calculate the vertical divergence that the slit will pass. On B.L.s 4 and 7, there are slits before the monochromator which are potentially defining vertical apertures in a focused mode and on B.L.s 6 and 10 the Be window aperture must be considered, as it is downstream of the mirror.
To determine the horizontal acceptance in unfocused mode the beam width at the sample is divided by the distance to the source (25 m on 4-2 and 7-2, 23 m on 6-2 and 10-2, 19 m on 7-3 and 20 m on 4-1 and 4-3). The horizontal acceptance in focused mode is complicated by the acceptance of the mirror. B.L.s 4-2 and 7-2 can accept up to 4.5 mrad of beam horizontally. There is a V-slit before the mirror which defines the horizontal acceptance. On B.L.s 6 and 10 the mirror accepts up to 2.3 mrad horizontally. Note that 10 at 14.5 KG has a K of 17.4 and thus a horizontal fan of 5.9 mrad (FWHM) whereas 6 at 8.5 KG has a K of 5.6 and a horizontal fan of 1.9 mrad (FWHM), less than the acceptance of the mirror. At 5 KG 6-2 only produces a horizontal fan which is 1.1 mrad wide.
The vertical acceptance of the mirrors can be calculated as follows. For B.L.s 6 and 10, the mirror has an angle of incidence of 3.5 mrad, a length of 700 mm and a distance to the source of 13.35 m, so its effective vertical acceptance is 184 mrad. The mirrors on B.L.s 4-2 and 7-2, with an angle of incidence of 7 mrad and a length of 600 mm at a distance of 12.5 m has an effective vertical acceptance of 336 mrad. As discussed earlier, these are not rectangular apertures so the actual acceptance of the mirror is not simply calculable.
There is another contribution to the vertical divergence when using
focused radiation. Because of the focusing properties of the bent
cylindrical mirror, the larger the horizontal swath of radiation collected,
the larger the vertical divergence of the beam after the mirror.
The equation is where q is the angle of incidence on the mirror and whoriz
is the horizontal acceptance of the mirror. This increased vertical
divergence will effect the energy resolution of the monochromator as discussed
above.
Ion Chamber Calculation
Figure 6 is included to convert the current measured in an ion chamber to the number of photons incident on the ion chamber. There are two curves in Figure 6. The curve associated with the left abscissa is the absorption of N2 as a function of energy in cm-1. The curve associated with the right abscissa is the same N2 absorption converted to number of incident photons/sec, based on a 15 cm (6") ion chamber. This curve was obtained using the equation Thus the curve is the number of photons incident on the ion chamber per amp of ion chamber current. These curves have been corrected for Kapton tape absorption on the front of the ion chamber. The energy loss per electron (34.6 eV/e-) is specifically for N2. Other gases have different values, ranging from 26.2 for Ar to 33.7 for air and 41.5 for He. Note that to compare the values from this curve to the values obtained for the theoretical flux the number of mA in the ring must be included, either by dividing the flux derived above by the number of mA in the ring or by multiplying the theoretical flux by the same number. A word of warning is in order here, too. The ion chamber can saturate at high flux levels, requiring the bias voltage to be increased. An ion chamber is supposed to work in a plateau region where the current is essentially constant with increasing voltage.

Figure 7 defines the operating limits for the Be windows on B.L.s 6 and 10. These limits are set by the power level on the window and can be reduced by inserting carbon filters upstream of the window. At the highest currents and smallest gap settings, both carbon filters are necessary to keep the window from overheating. For a larger gap or lower current, one or both of the filters can be removed. At less than roughly 5KG gap setting both filters can be removed regardless of current in the machine. The change in flux is most significant at energies below 4 keV. The curves in Figure 1 show two settings for B.L. 6; 5KG with no C filter and 8.5 KG with both C filters.

Table 1
Beam line Apertures
|
|
|
|
|
|
|
|
|
|||
|
|
|
|||
|
|
||||
|
|
|
|||
|
|
|
|
|
|
|
|
|
|
||
|
|
|
|
|
|
|
|
|
|
|
|
|
|
|
|
|
|
|
|
|
|
|
|
|
|
|
|||
|
|
||||
|
|
|
|
|
|
|
|
|
|
|
|
|
|
|
|
|
|
For accurate comparisons between theoretical and measured flux one should include additional absorbers such as the absorption due to the air gap between ion chamber, the Kapton window on the monochromator and the Kapton tape on the ion chambers. For completeness here are some transmission values for Kapton foil and tape.
Table 2
Kapton Transmission
|
|
|
|
|
|
|
|
|
|
|
|
|
|
|
|
|
|
|
|
|
|
|
|
|
|
|
|
|
|
|
|
Acknowledgements
I have had a number of interesting discussions in the course of writing
this and would like to thank John Arthur, Richard Boyce, Paul Cowan, Bill
Lavender and Teresa Troxel for their help in the compilation of these graphs.
Rather than put specific references in the text what follows is a list
of references which were useful in this compilation. A word of warning,
Jackson uses definitions which are different from those of the synchrotron
community and should be used with extreme caution.
| 1. | Properties of Synchrotron Radiation, C. Kunz, in Synchrotron Radiation, Techniques and Applications, ed. C. Kunz, Springer-Verlag, 1979. |
| 2. | Theory of Synchrotron Radiation, A. Hofmann, SSRL ACD-NOTE 38, (1986). |
| 3. | X-ray Data Booklet, ed. D. Vaughan, Lawrence Berkeley Laboratory. |
| 4. | S.M. Heald and J.B. Hastings, NIM 187, 553 (1981). |
| 5. | Radiation Dosimetry Vol 1, eds. F.H. Attix and W.C. Roesch, Academic Press (1968). |